Post-mortem · Systematic options strategy · Python
Built January 2026 · Live March – May 2026 · Post-mortem October 2026
SPX Income Trader (“Daily Melt”)
An automated 0DTE S&P 500 credit-spread strategy that I live-tested for seven weeks and then paused. This is my blameless review of what the live test showed, the rebuilt backtest that explained the result, and the evidence-gated plan for any future live trading.
Net live P&L
−$3,326.72
After all fees · reconciled with the broker
Live trades
21
9 wins · 12 losses (42.9%)
Trial length
~7 weeks
Mar 10 – May 1, 2026 · then paused
Contracts per trade
1–4
Sized by risk · 2% of equity per day
A personal research and engineering project. Nothing here is investment advice or a recommendation to use any strategy. Options trading involves substantial risk of loss. Backtested and simulated results are hypothetical and do not represent actual trading; live figures are from a small personal account and are shown only to document the project.
Summary
Daily Melt sells one at-the-money, $5-wide SPX credit spread per day in the direction of a morning momentum signal. After about five weeks of paper trading it went live on March 10, 2026. Over 21 trades it won 9 and lost 12 and finished down $3,326.72 after fees. I paused it after the May 1 session because the live results were far below what the backtest had promised.
Two findings explain the gap. First, the original backtest was wrong. It built its intraday bars from each day’s open, high, low and close, and its trend filter used the day’s closing price, which the live bot never has in the morning. That inflated the win rate to 77.5%; removing just the look-ahead dropped it to 54.8%. Second, once I rebuilt the backtest honestly on real one-minute S&P 500 data for 1,957 sessions, the strategy itself turned out to lose money: −$14.7 per trade over 1,082 trades, and −$21.1 per trade in the 2023–2026 out-of-sample period (t = −2.2). The signal has a small real edge, worth about $12 a trade, but the round trip costs about $31. The honest backtest agreed with the live result on win or loss on 14 of the 16 days where both traded, so the live loss was not bad luck.
None of the 19 single-rule changes I tested made the strategy reliably profitable out of sample. The engineering held up and is reusable, and Daily Melt stays paused.
What I built
SPX Income Trader is a Python application, with roughly 1,500 automated tests, that trades same-day-expiry (0DTE) options on the S&P 500 index through a broker’s REST API without manual input. The interface calls it “The Daily Melt”, after the time decay that 0DTE option sellers collect. SPX options are European-style and cash-settled, so there is no early assignment and nothing is held overnight.
The signal works in six steps:
- Bars. SPX quotes about every 30 seconds, built into 30-minute bars.
- Pulse bar. A bar starting 9:30–10:30 closes in the top or bottom 10% of its range (range ≥ 2 points).
- Bias filter. Skip setups against a ±0.25% move from the open.
- Breakout. Enter when price breaks the bar’s high or low before 11:30 ET.
- Spread. Sell an at-the-money $5 bull put or bear call at the natural price, for a credit of at least $1.00.
- Exit. Buy back at 80% of max profit, otherwise hold to the 4:00 PM settlement.
Around that signal I built the plumbing a desk would expect: budget-based sizing (2% of equity at risk per day) with hard contract caps; daily, weekly and monthly loss breakers (2%, 4%, 8%) and a pause after five straight losses; pattern-day-trader checks; limit-only orders; positions valued at what it would actually cost to close; reconciliation of every trade against the broker’s own transaction records, fees included; alerts; a dashboard; and a backtester that runs the same strategy objects over history. Max loss is known before every order because only defined-risk spreads are allowed.
The live record
| Date (2026) | Event |
|---|---|
| Feb – early Mar | About five weeks of paper trading. The simulated account grew from $50,000 to $60,000, but the simulator priced options with a simplified model, so this was not independent evidence of edge. |
| Mar 10 | First live session at one contract. Fill parsing, position valuation and an unrealized-profit cap fixed the same day. |
| Mar 11 | First live trade (loss, −$337.44). A database lock let a trade fill with no local record; fixed by writing the record before any order is sent. |
| Mar 13 – Apr 1 | Budget-based sizing scaled up to 2, then 3–4 contracts as the 2% rule allowed. The record reached 5W/2L and +$928 by Mar 20; the next four trades, at 2–4 contracts, all lost. |
| Mar 31 | Monthly loss budget 94% used; no new entries. March: 10 trades, 5W/5L, −$1,861.72. |
| Apr 1 – 2 | Size cut to 2 contracts, then to 1 for the rest of the trial. |
| May 1 | 21st trade (loss). Final record 9W/12L, −$3,326.72. Live trading paused. |
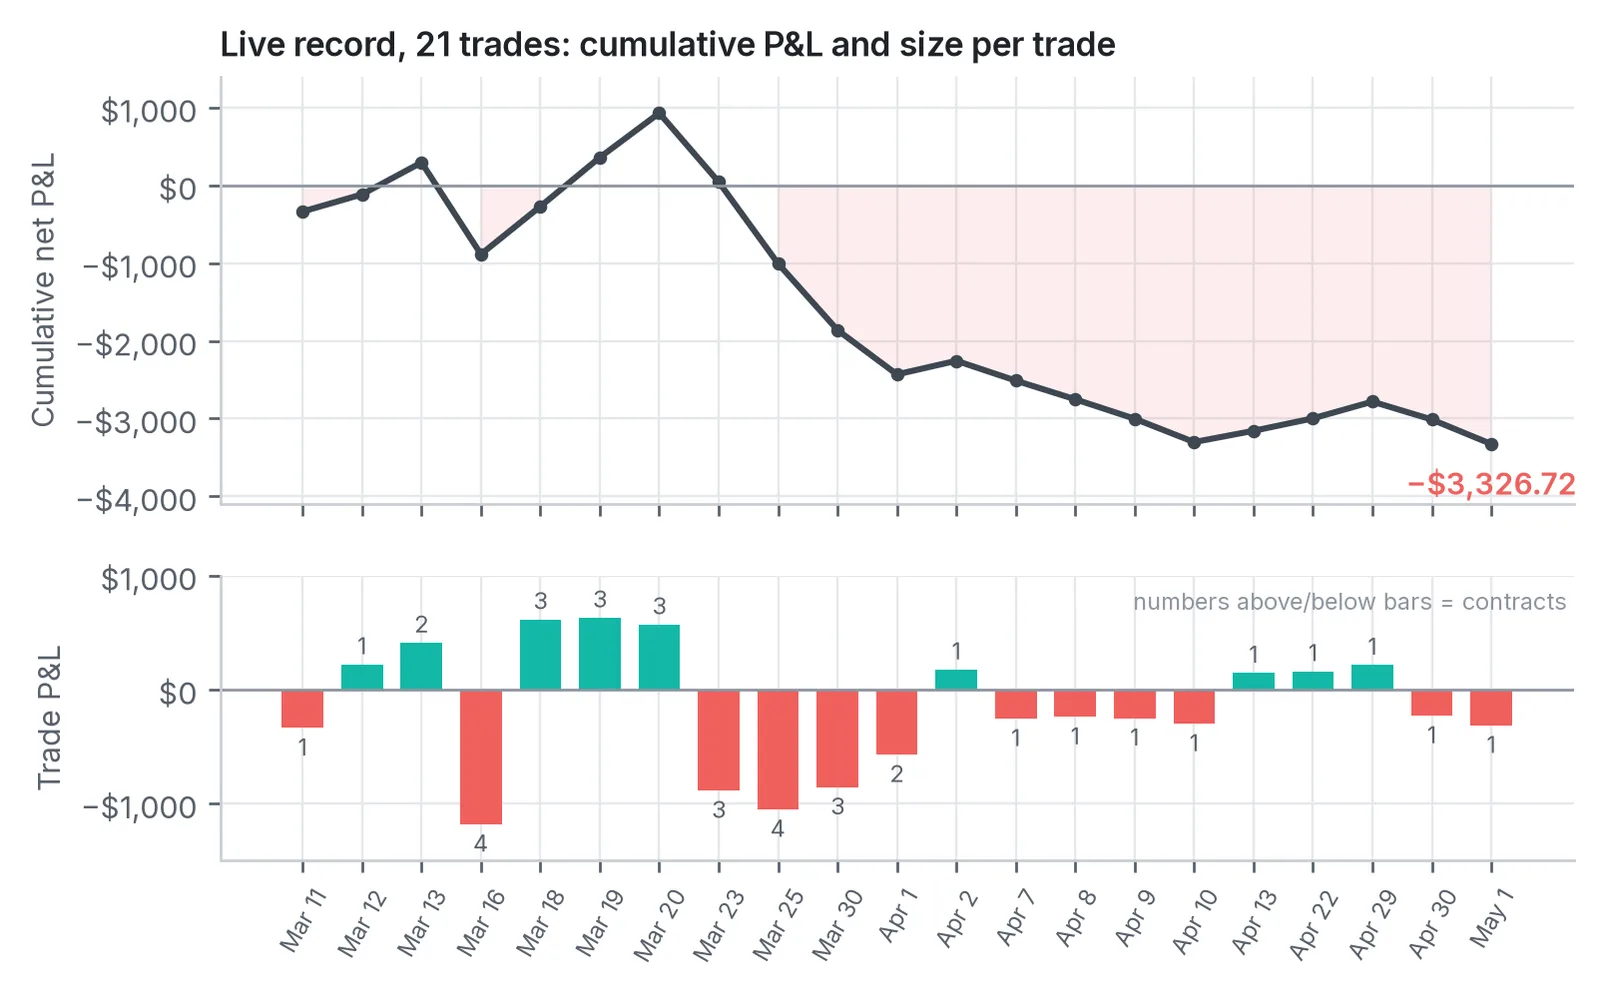
Figure 1 · LIVE. Live record, Mar 11 – May 1, 2026: 21 trades, 9 wins and 12 losses, −$3,326.72 net of all fees as reconciled against the broker. Numbers on the bars are contracts per trade; nine trades at 2–4 contracts produced −$2,314.58 of the total.
| Live, Mar 11 – May 1, 2026 | Trades | Wins / losses | Net P&L |
|---|---|---|---|
| March (1–4 contracts) | 10 | 5 / 5 | −$1,861.72 |
| April (1–2 contracts) | 10 | 4 / 6 | −$1,150.00 |
| May 1 (1 contract) | 1 | 0 / 1 | −$315.00 |
| Total | 21 | 9 / 12 (42.9%) | −$3,326.72 |
Scaled to one contract, my average live win was about $192 and my average live loss about $279. That shape, small wins and larger losses, means the strategy needs to win close to 60% of the time just to break even. It won 43%.
At the time, my daily log blamed the losses on opening gaps and headline-driven reversals and proposed a gap filter. That was a reasonable read from inside the trial, but the review showed it was not the main driver: in the honest backtest the small-gap days were actually the worst, and gap filters did not help out of sample.
Why it lost: look-ahead bias
An audit of the original backtest engine found three defects that together made the strategy look far better than it was:
- Synthetic intraday data. The free data source keeps only about 60 days of 30-minute history. For older dates the loader quietly built 30-minute bars from each day’s open, high, low and close, along a fixed path that depended on whether the day closed up or down. The pattern the signal reads therefore already contained the day’s outcome.
- Look-ahead in the trend filter. The morning-bias filter used the full-day return (close versus open). The live bot can only use the move from the open so far. This alone accounts for most of the inflated win rate.
- Mis-scaled 0DTE time. The option model measured time left in calendar hours rather than trading time, which understated the remaining volatility by roughly 2×, so modelled spreads hit the 80% profit target too often.
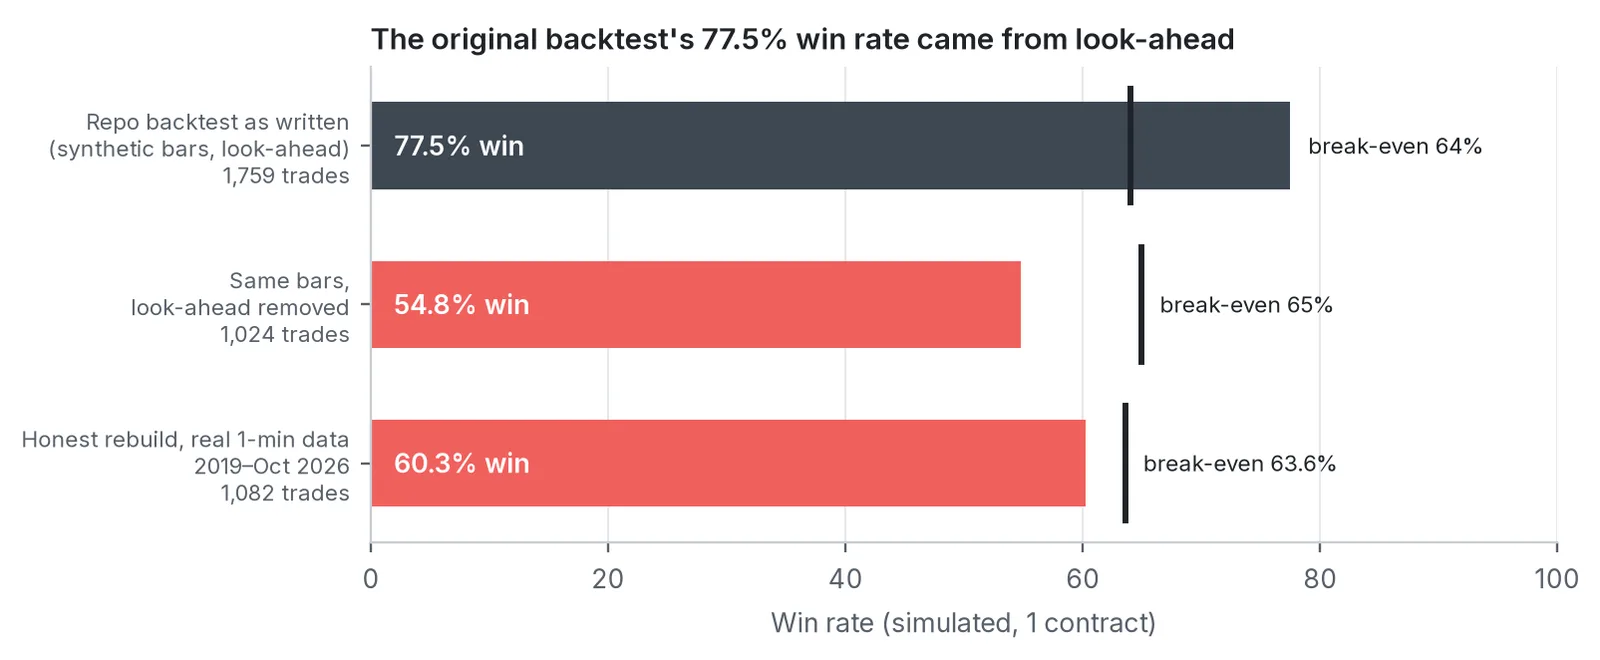
Figure 2 · SIMULATED backtest. Simulated, 1 contract: the original backtest’s 77.5% win rate came from synthetic intraday bars and look-ahead in the trend filter. With the look-ahead removed it falls to 54.8%; the honest rebuild on real 1-minute data (2019–Oct 2026) wins 60.3%, below its 63.6% break-even.
It was not caught earlier because the backtest and the paper-trading simulator shared the same simplified option model, so the paper account’s 20% gain seemed to confirm the backtest when both were wrong in the same direction. There was also no automated test comparing the backtester’s decisions with the live engine’s on the same bars.
The honest backtest
To measure the strategy itself, I rebuilt the backtest from scratch: real one-minute S&P 500 paths for 1,957 sessions (January 2019 to October 16, 2026), strict no-look-ahead decisions, and modelled 0DTE option prices with skew, bid/ask spreads and $1.30 per leg in fees. I replayed the live rules exactly, with nothing tuned, treating 2019–2022 as in-sample and 2023–2026 as held out.
| Live rules, simulated, 1 contract | Trades | Win % | Per trade | Avg win / loss | Profit factor | Max drawdown | t |
|---|---|---|---|---|---|---|---|
| 2019–2022 (in-sample) | 555 | 61.4 | −$8.5 | $157 / −$273 | 0.92 | −$8.2k | −0.9 |
| 2023–2026 (out-of-sample) | 527 | 59.0 | −$21.1 | $160 / −$282 | 0.82 | −$11.9k | −2.2 |
| All | 1,082 | 60.3 | −$14.7 | $159 / −$278 | 0.87 | −$18.5k | −2.2 |
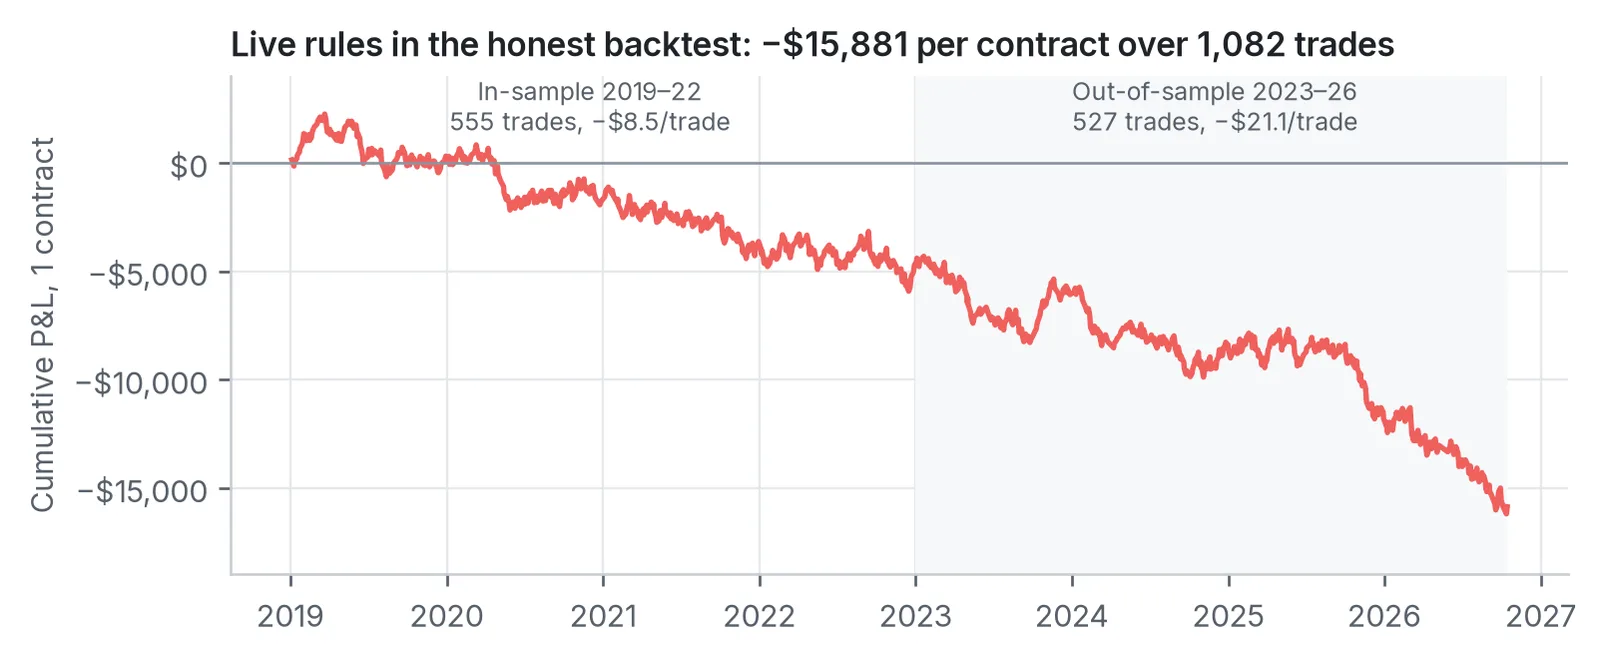
Figure 3 · SIMULATED backtest. Simulated, 1 contract, after costs: the exact live rules lose −$15,881 over 1,082 trades (−$14.7 per trade, profit factor 0.87). In-sample 2019–22: −$8.5 per trade; out-of-sample 2023–26: −$21.1 per trade.
The payoff is lopsided. With an average loss of $278 and an average win of $159, the break-even win rate is 63.6%, and the strategy wins 60.3%. A $5-wide at-the-money spread is tiny next to a typical 40–60 point rest-of-day move, so it nearly always settles fully in or fully out of the money. In effect it is a binary bet on the close, and the market prices that bet close to fairly.
Where the costs go
The signal is real but too weak. Price closed in the signal’s direction 53.6% of the time. Taking the same entry times with a random direction loses −$27 per trade on average (90% range −$37 to −$19), so the pulse signal beats 98% of coin flips and adds about $12 per trade. That is a genuine, if small, edge. The problem is what it costs to trade.
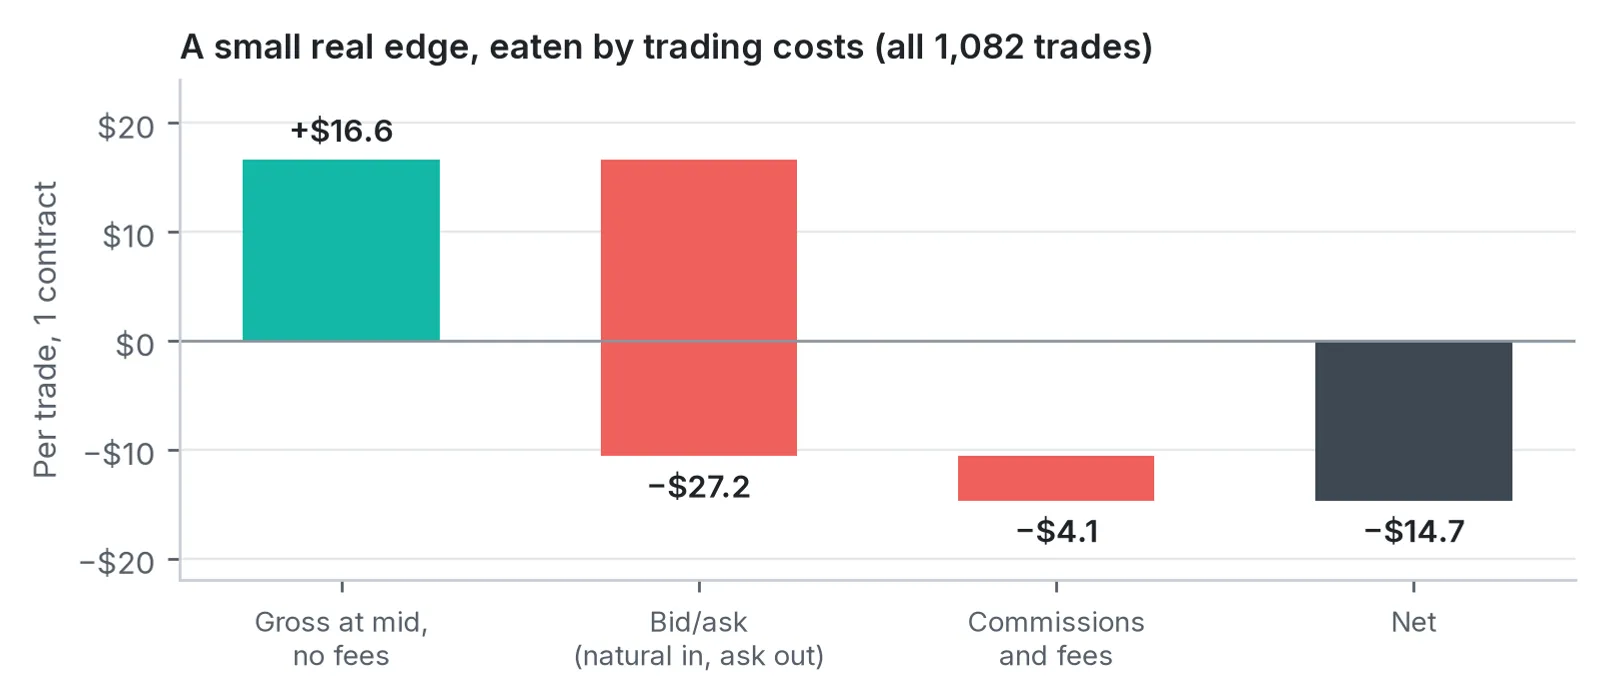
Figure 4 · SIMULATED backtest. Cost attribution over 1,082 simulated trades: at mid prices with no fees the rules make +$16.6 per trade; bid/ask costs $27.2 and commissions $4.1, leaving −$14.7. A small real edge, eaten by trading costs.
Side and exit analysis
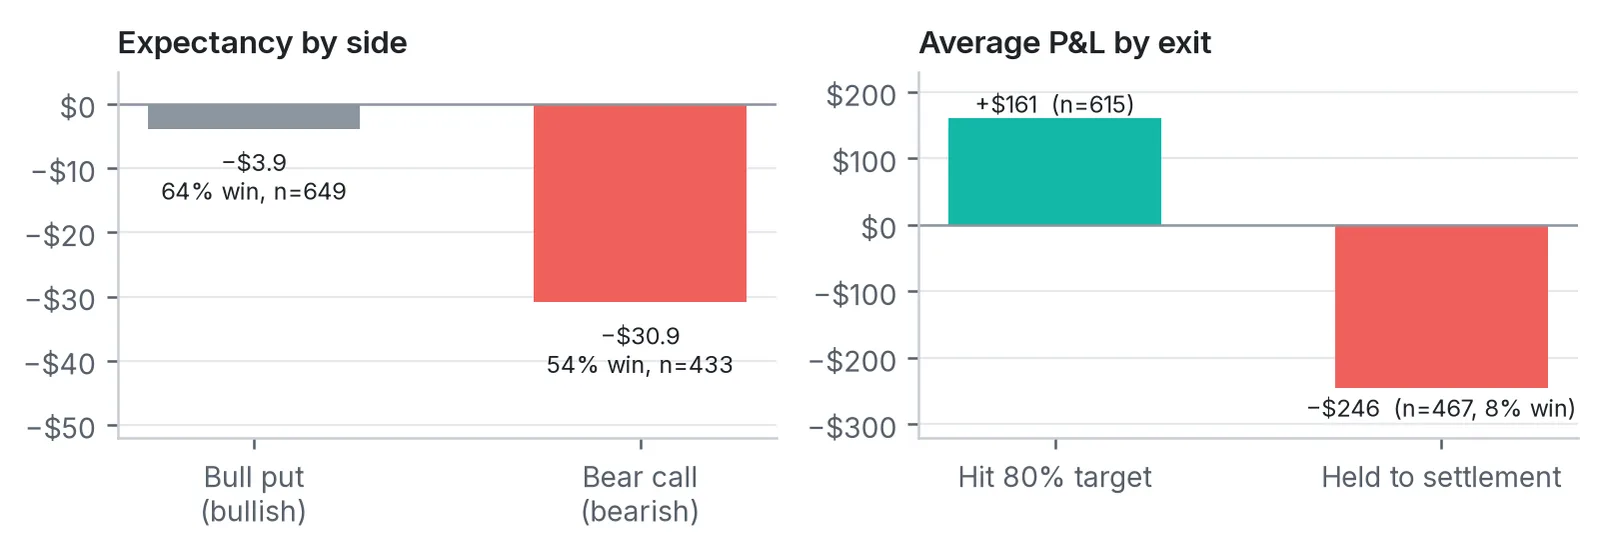
Figure 5 · SIMULATED backtest. Simulated: bear call spreads lose −$30.9 per trade (54% wins) against −$3.9 for bull put spreads (64% wins). Trades that reach the 80% target average +$161; the 467 held to settlement average −$246 and win only 8% of the time.
Bear call spreads fight the market’s upward drift, and trades held to settlement are where most of the damage happens. I tested 19 single changes to the rules, one at a time, judged on the held-out 2023–2026 period. None is reliably profitable. A selection:
| Change (one at a time) | In-sample $/trade | Out-of-sample $/trade | OOS profit factor | OOS t |
|---|---|---|---|---|
| Live rules (reference) | −8.5 | −21.1 | 0.82 | −2.2 |
| Skip days with an opening gap above 0.5% | −12.4 | −21.0 | 0.82 | −1.8 |
| Ignore the 9:30 bar when the gap exceeds 0.3% | −13.5 | −17.4 | 0.85 | −1.7 |
| Skip Fed (FOMC) days | −9.0 | −21.8 | 0.81 | −2.2 |
| Take profit at 50% instead of 80% | −21.2 | −34.8 | 0.66 | −4.2 |
| Stop-loss at 2× credit | −35.8 | −46.4 | 0.62 | −5.5 |
| No profit target (hold to settlement) | −0.1 | −12.8 | 0.90 | −1.2 |
| At the money, $10 wide (best in-sample) | +25.2 | −6.6 | 0.97 | −0.4 |
| 20-delta short strike, $10 wide (best out-of-sample) | +3.7 | +4.1 | 1.06 | +0.4 |
Stops and tighter profit targets made results worse in every version, because they add a second round of bid/ask to a trade whose outcome is mostly decided at the close. The “$10 wide” line is a useful warning: it was the best directional result in-sample and fell apart on held-out data. The best out-of-sample result (+$4.1, t = 0.4) is statistically indistinguishable from zero.
Model vs live
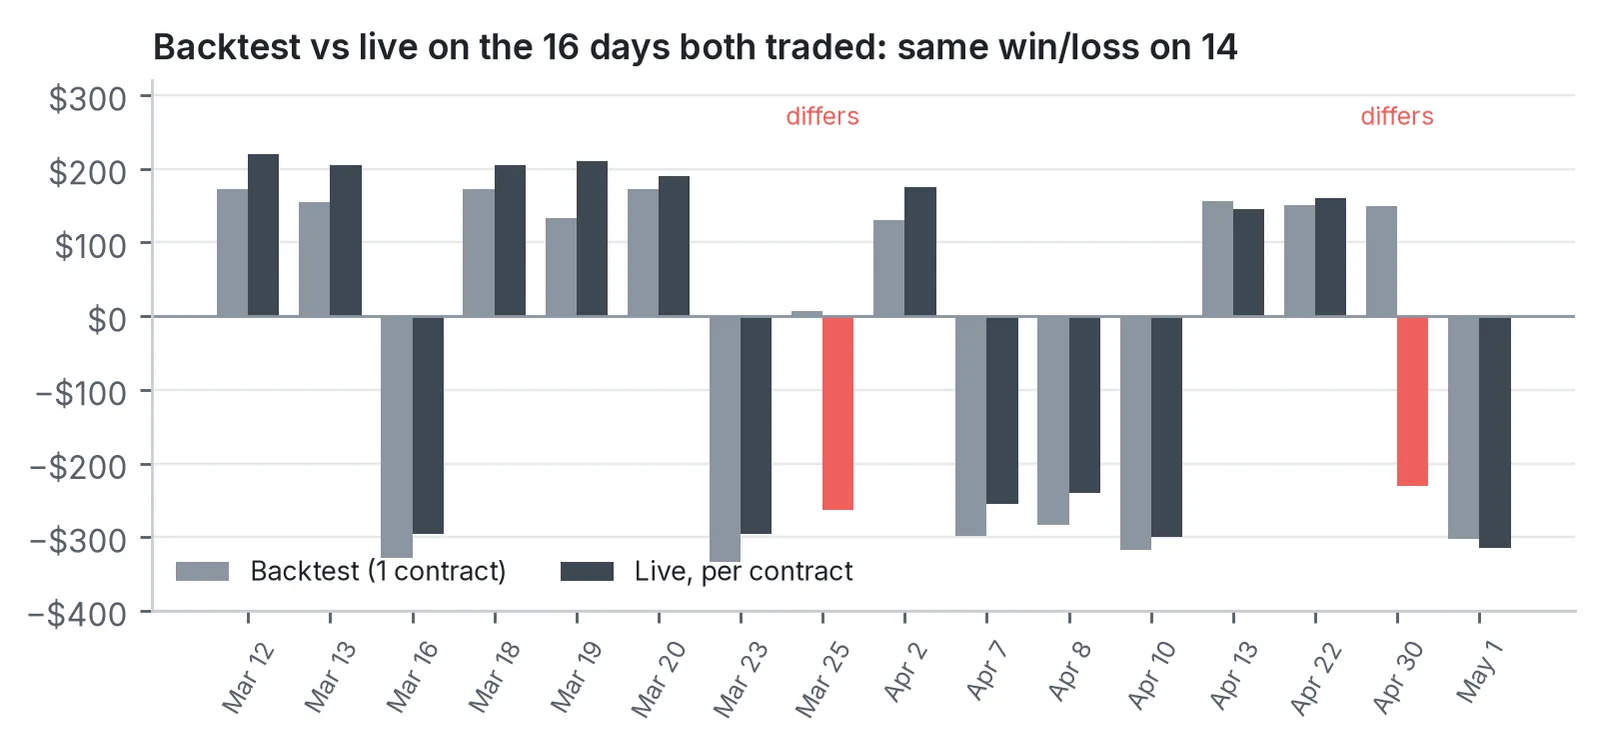
Figure 6 · SIMULATED vs LIVE. The rebuilt backtest replayed over the live window, per contract: it agrees with live on win or loss on 14 of the 16 days both traded. The model was more forgiving than live (68% vs 43% wins), so if anything the backtest flatters the strategy.
Two other things made the loss bigger than it needed to be. Sizing grew before the edge was proven: the 2% rule worked as designed and allowed up to four contracts, but size scaled up in the first week of live trading, before there was any live evidence, and nine trades at 2–4 contracts produced about 70% of the total loss. Operations were good but not clean: the broker’s seven-day login token expired three times and the operating system once blocked the unsigned desktop build, which together cost five sessions. None of these caused a trading loss, but each is a reason my next platform treats broker authentication and data freshness as hard pre-trade checks.
The iron condor alternative
Because no directional variant worked, I searched a different structure: a non-directional 0DTE iron condor, which sells both a put spread and a call spread and profits if SPX stays inside a range until the close. The grid had 160 settings (entry 10:00–14:00, short strikes 5–20 delta, $5 or $10 wings, with and without targets and stops), chosen on 2019–2022 only. 66 of the 160 were positive out of sample, and in-sample and out-of-sample Sharpe ratios correlated at 0.98, which points to a structural effect rather than curve-fitting, under this pricing model.
| Candidate A: 12:00 ET, 10-delta shorts, $10 wings, stop at 2× credit | Trades | Win % | Per trade | Profit factor | Max drawdown | Sharpe |
|---|---|---|---|---|---|---|
| 2019–2022 (in-sample) | 1,006 | 70.6 | +$16.6 | 1.49 | −$5.1k | 3.0 |
| 2023–2026 (out-of-sample) | 951 | 69.4 | +$20.9 | 1.57 | −$2.9k | 3.5 |
| Anchored walk-forward (2021–2026) | 1,454 | 67.1 | +$28.3 | 1.46 | −$11.8k | 2.9 |
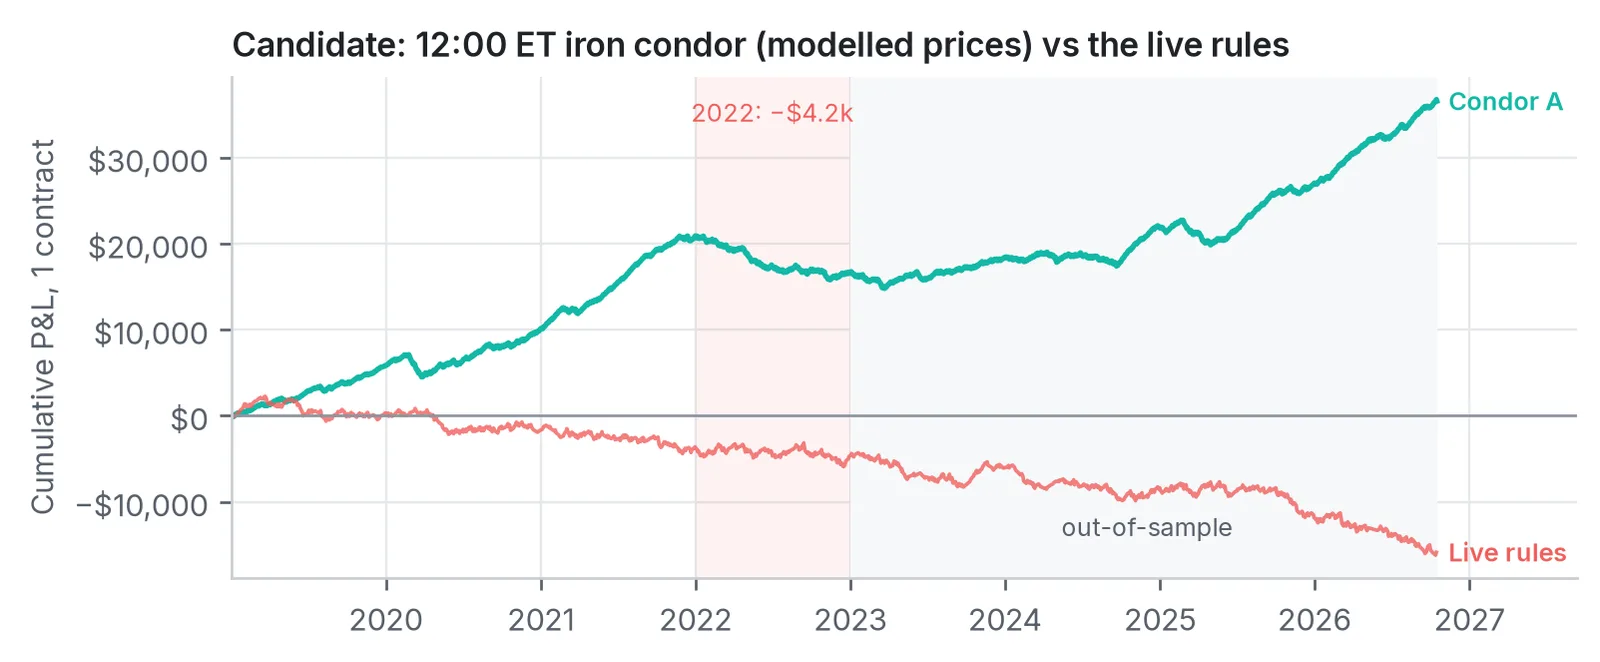
Figure 7 · SIMULATED backtest (modelled option prices). Candidate, not proven: a 12:00 ET iron condor (10-delta shorts, $10 wings, stop at 2× credit) on modelled prices, 1 contract, after costs, against the live rules. Out-of-sample +$20.9 per trade, 69% wins, max drawdown −$2.9k; 2022 lost −$4.2k.
Why it is not proven. The condor sells options, so it only makes money if real 0DTE options are priced richer than the moves that follow. Free historical data cannot show that; my option prices are modelled, with at-the-money volatility set at 0.62 × VIX and calibrated two ways that agree. The result is sensitive to that choice and to trading costs:
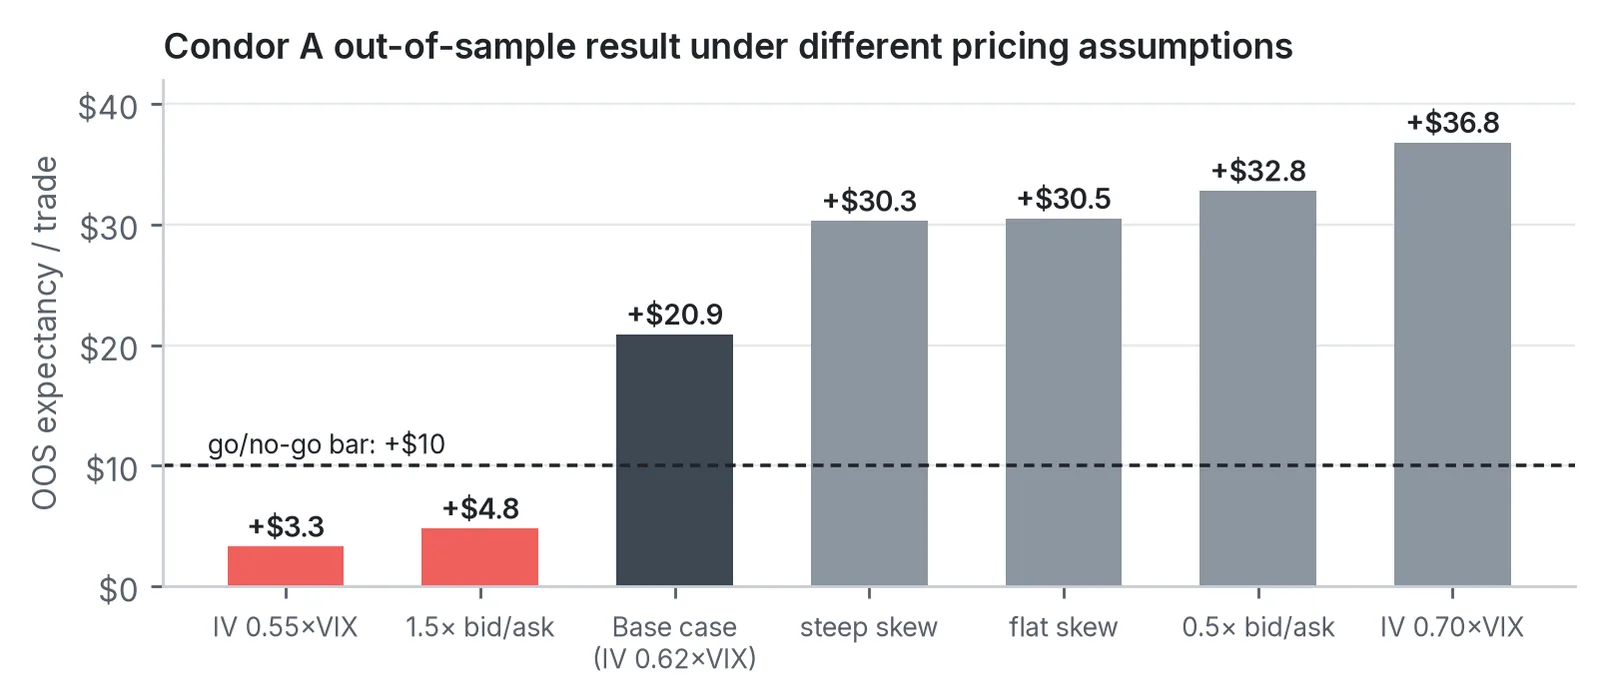
Figure 8 · SIMULATED backtest (modelled option prices). The condor’s out-of-sample expectancy depends on pricing assumptions: +$20.9 per trade in the base case, but only +$3.3 with implied volatility at 0.55× VIX and +$4.8 with 50% wider bid/ask, both below the +$10 go/no-go bar.
The walk-forward shows the risk plainly too: the 2022 test year, a trending, high-volatility market, lost $9.6k per contract under the setting it picked that year. Execution matters as much as the edge: working orders from the mid-price instead of selling at the natural price saves roughly $0.05–0.10 per spread, about a third of the modelled edge.
What I learned
- A backtest is a hypothesis, not evidence, until it has been tested for look-ahead. The most expensive bug was one line that let a morning decision see the closing price. Every decision now has to be computable from data available at that minute, and a parity test runs the backtester and the live engine on the same bars.
- Two tests built on the same model are one test. The paper account and the backtest agreed because they shared an option model. Validation now requires an independent source: recorded real market quotes.
- Measure the edge against the cost of trading it. The signal was real. The strategy still lost, because $12 of edge cannot pay $31 of friction.
- Hold the data out, and believe it. The best in-sample variant was among the worst out of sample. Parameters are now chosen on 2019–2022 only and judged on 2023–2026, with a walk-forward check on top.
- Size for what you know, not what the account allows. New strategies start at one contract and stay there until they have a meaningful live record (100+ trades).
- Diagnose with the whole sample. The in-trial explanation (gaps) fit the last few losses but not the 1,082-trade history.
- Write the stop rule before starting. I paused the trial on judgment after 21 trades. It should have had a written kill criterion from day one.
Since the review I have fixed the backtester (look-ahead, real minute data, 0DTE pricing, parity with the live rules), added a read-only option-quote recorder and tightened position sizing, so the code skips a trade instead of forcing one contract when one contract’s max loss exceeds the daily budget. The test count went from 1,514 to 1,642. All of it sits on a separate branch; the live code path is untouched.
The evidence-gated plan
The condor cannot reach live money on the strength of a backtest alone. Each gate must be passed in order, against thresholds written down now, and changing any strategy parameter resets it to the first gate.
| Gate | Pass criteria (all must hold) | If it fails | Status |
|---|---|---|---|
| 1. Research | Out-of-sample expectancy ≥ +$10 per contract after commissions and modelled bid/ask; profit factor ≥ 1.2; walk-forward positive; ≥ 200 out-of-sample trades; positive under wider bid/ask; drawdown fits the risk budget. | Strategy locked. | Passed with warnings |
| 2. Real quotes | ≥ 20 recorded sessions (4–6 weeks). Replay on real bid/ask: modelled credit within $0.10 of real credit, and expectancy ≥ +$10 per contract after costs. | Condor shelved; no live change. | Starting |
| 3. Paper | ≥ 30 trading days and ≥ 25 trades through the full engine on real quotes at a conservative price, inside the backtest’s expected range, with zero unresolved reconciliation breaks. | Back to research, or shelved. | Not started |
| 4. Live, 1 contract | Manual enable with typed confirmation. One contract (max loss about $920). Scale only after ≥ 100 live trades, and then by no more than a quarter of the Kelly fraction. | Automatic demotion. | Not started |
Either of two rules demotes a live strategy to paper with no manual decision: live drawdown beyond 1.5× the backtest’s maximum drawdown (about $4.3k per contract for Candidate A), or, after 50 live trades, a 95% upper confidence bound on live expectancy below zero. If every gate passes on its minimum, a one-contract live trade is roughly three months away at the earliest. A fail at gate 2 is a perfectly acceptable outcome; it would cost nothing but time.
What's next
Allocation Desk (in development). A modular automated-trading dashboard where I allocate capital to individual strategies, each sized by risk and locked out of live money until it passes an evidence gate (out-of-sample backtest, real-quote validation, paper trading). Daily Melt appears in it as locked, failed at gate 1.