Portfolio analytics · Python · PySide6 · v3.0.0
Portfolio Analyzer
A native desktop portfolio analytics app for Windows and macOS: backtest, optimize, measure risk, plan retirement and watch your holdings live, with a plain-English explanation for every result. Current version is v3.0.0 (Jul 2026), now in the Graphite design. Details ↓
Live demo
Try a sample portfolio
Illustrative demo with a sample ETF portfolio · not investment advice
A browser version of a few of the app's tabs, running on real daily adjusted prices (…). Move the weights. Everything is recalculated in your browser, with monthly rebalancing and the 13-week T-bill as the risk-free rate. SPY is the passive benchmark.
Sample weights
Weights are normalized to 100%. Long-only.
Growth of $10,000
Performance summary
Drawdown from running peak
Efficient frontier & Capital Allocation Line
Dots: 2,500 random long-only mixes, colored by Sharpe ratio. Lines show annualized volatility (x) against annualized return (y).
Correlation of daily returns
Daily return distribution (Active)
Couldn't load the demo data.
Data: daily adjusted closes (dividends reinvested) from Yahoo Finance, saved Oct 14, 2026 and bundled with this page. Past performance doesn't predict future results. The desktop app adds attribution, factor models, tax-aware analysis, Monte Carlo forecasting and reports.
About the app
Why: Began on Nov 27, 2025 as my University of St. Thomas MS capstone: a simple optimizer where you enter stocks and get optimal weights. I kept extending it far beyond the optimizer.
110
commits
11
releases
~35.7k
lines of Python
316
pytest tests
- Nov 2025The capstone optimizer, built in Streamlit.
- Dec 2025Added Brinson-Fachler attribution, Black-Litterman, multi-factor regression, rolling risk and a hybrid data loader.
- ThenMoved to a native PySide6 desktop app, with GitHub Actions CI that builds the installers automatically.
- Graphite overhaulRebuilt in four phases: one canonical metrics module checked against reference libraries, the Graphite design, institutional risk and attribution analytics, and data-quality checks with fuller reports.
Features
Skills learned: Portfolio optimization methods, factor models, performance attribution, desktop GUI development, automated testing and CI/CD.
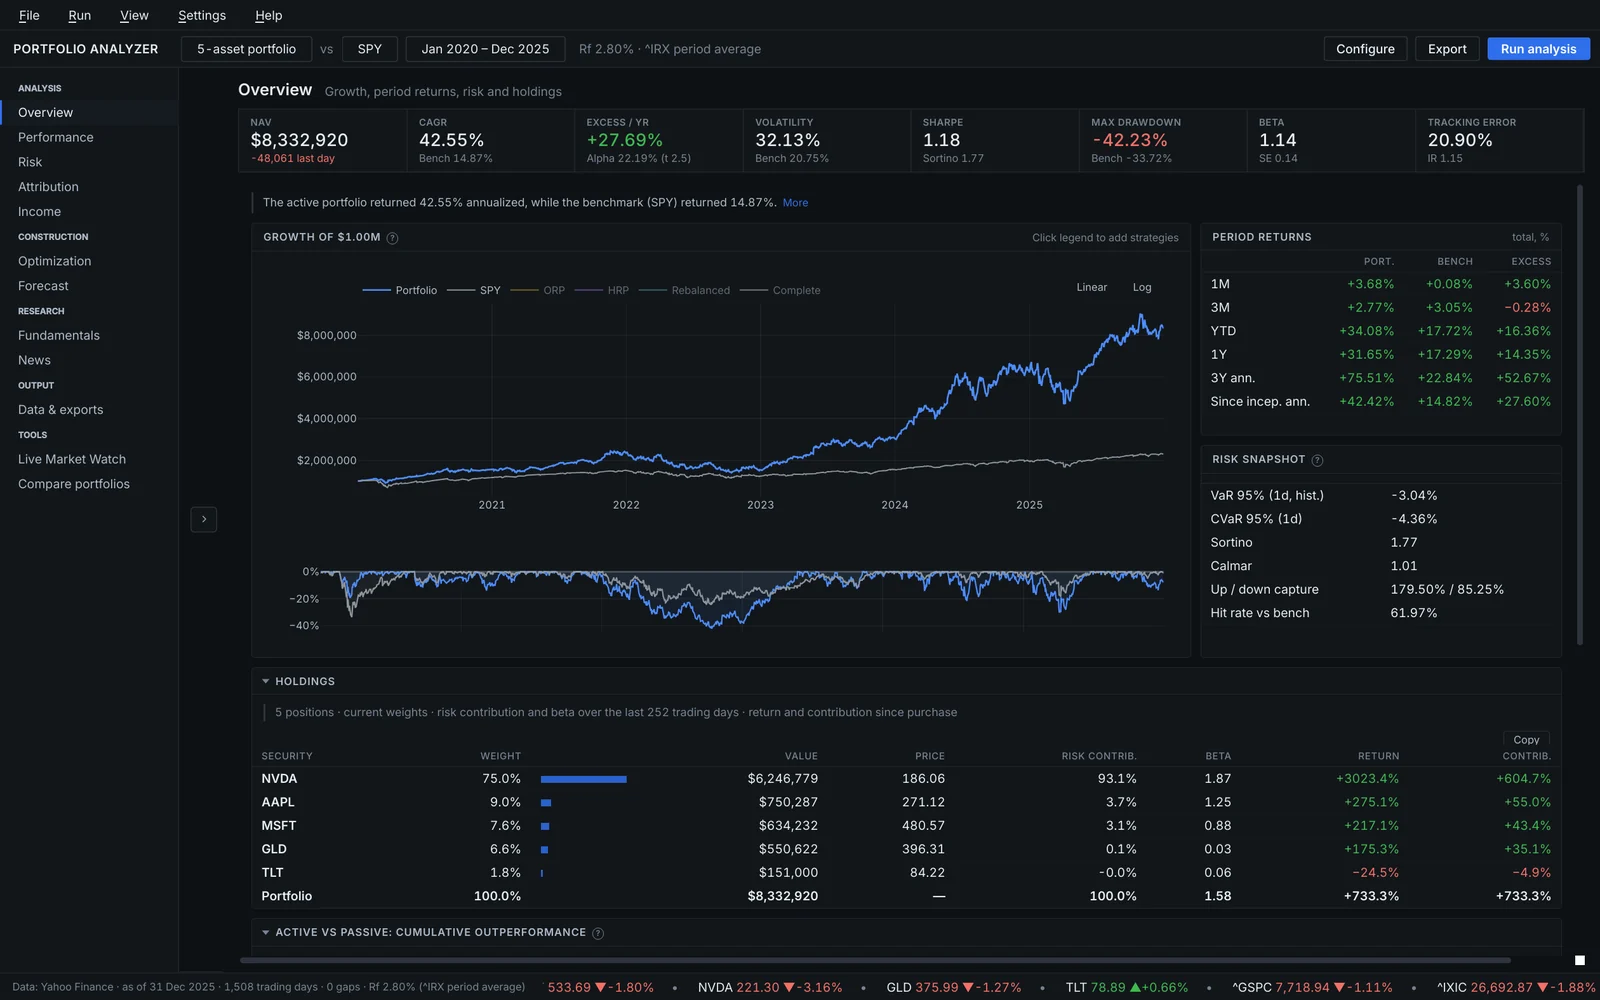
Overview
KPI strip with benchmark values, growth of $1M with drawdowns, period returns, risk snapshot and a sortable holdings table.
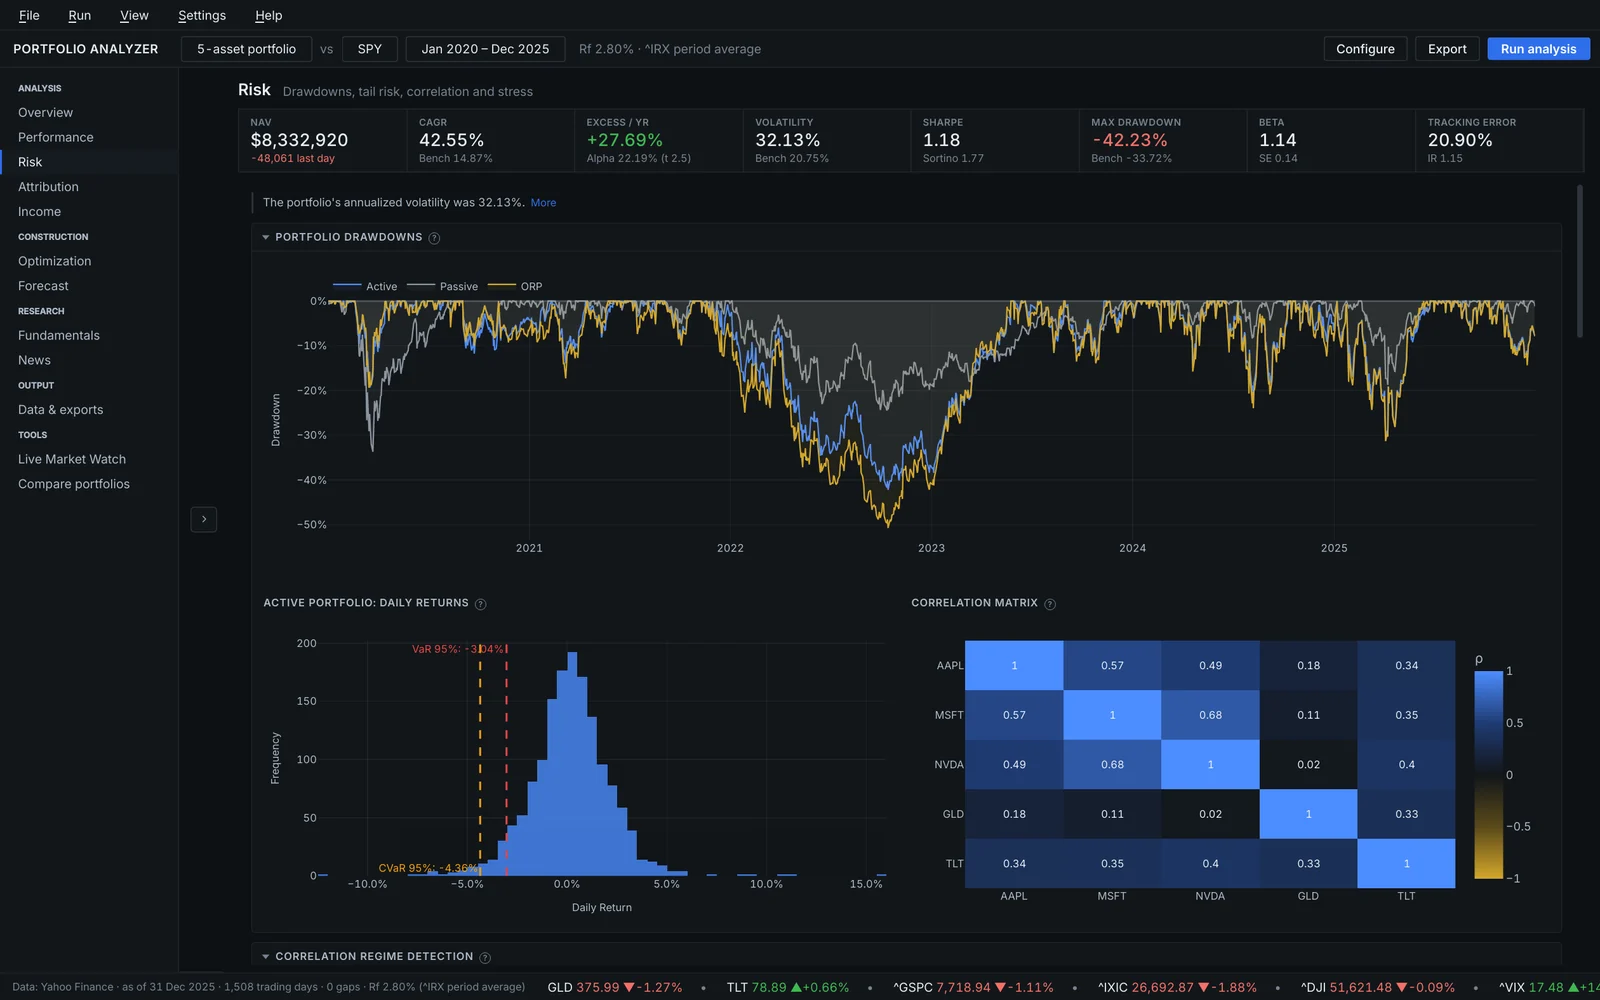
Risk
VaR and expected shortfall by four methods with a breach backtest, the largest drawdowns and historical stress tests.
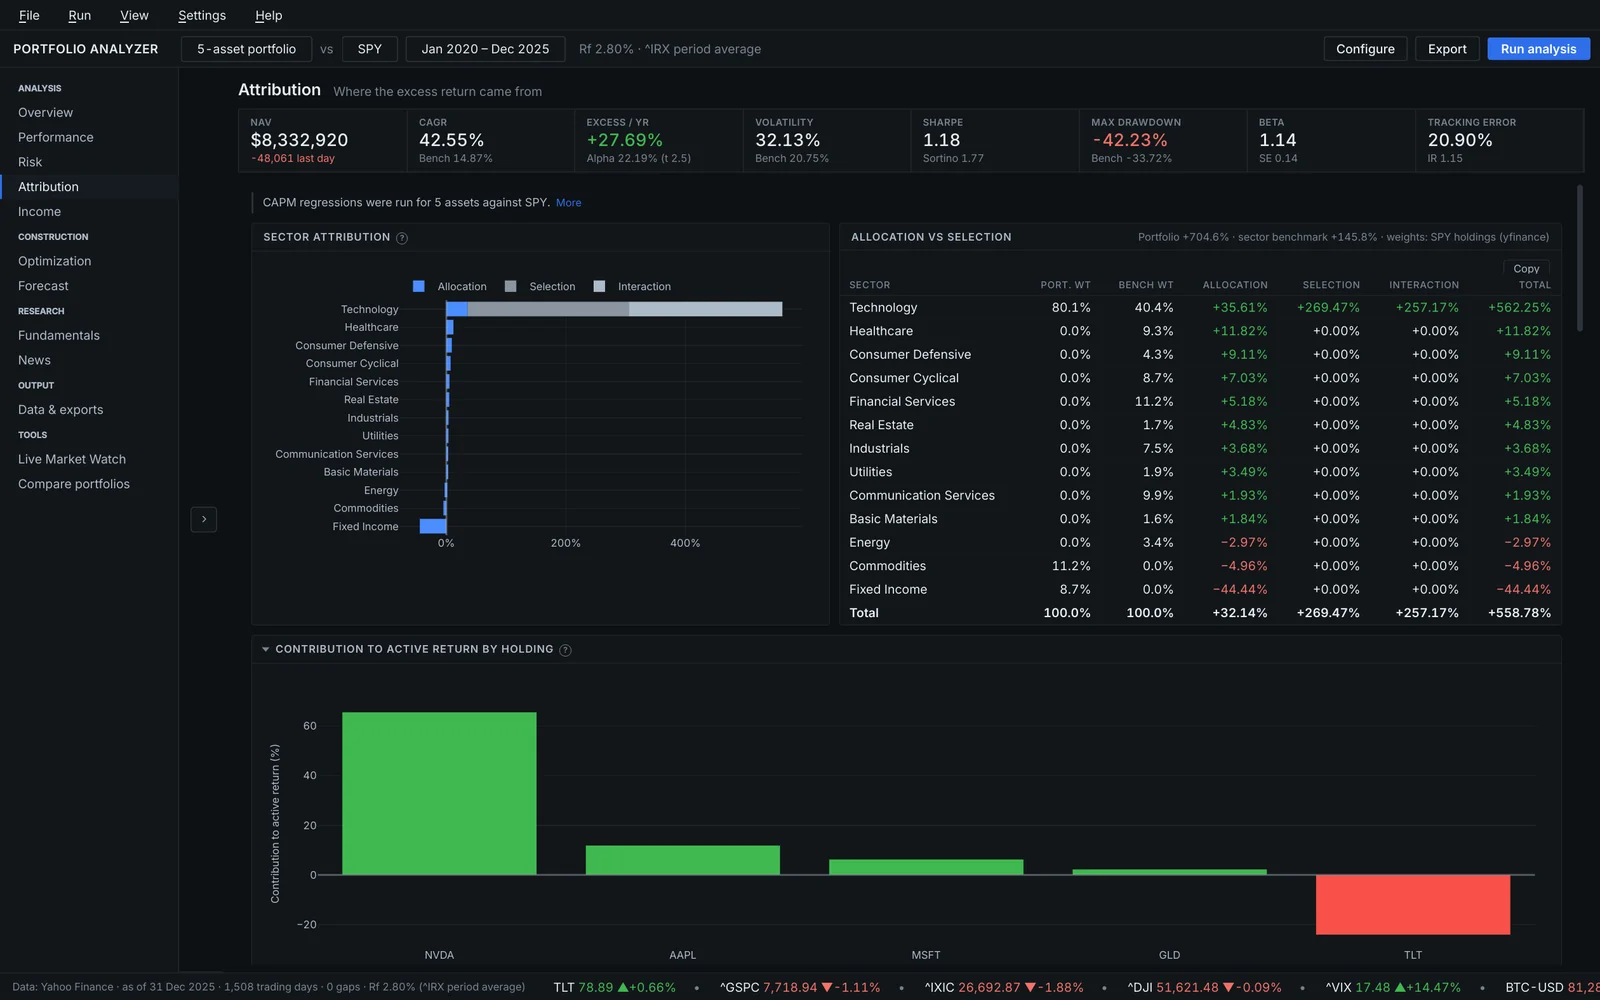
Attribution
Contribution to active return by holding plus Brinson-Fachler sector attribution against the benchmark.
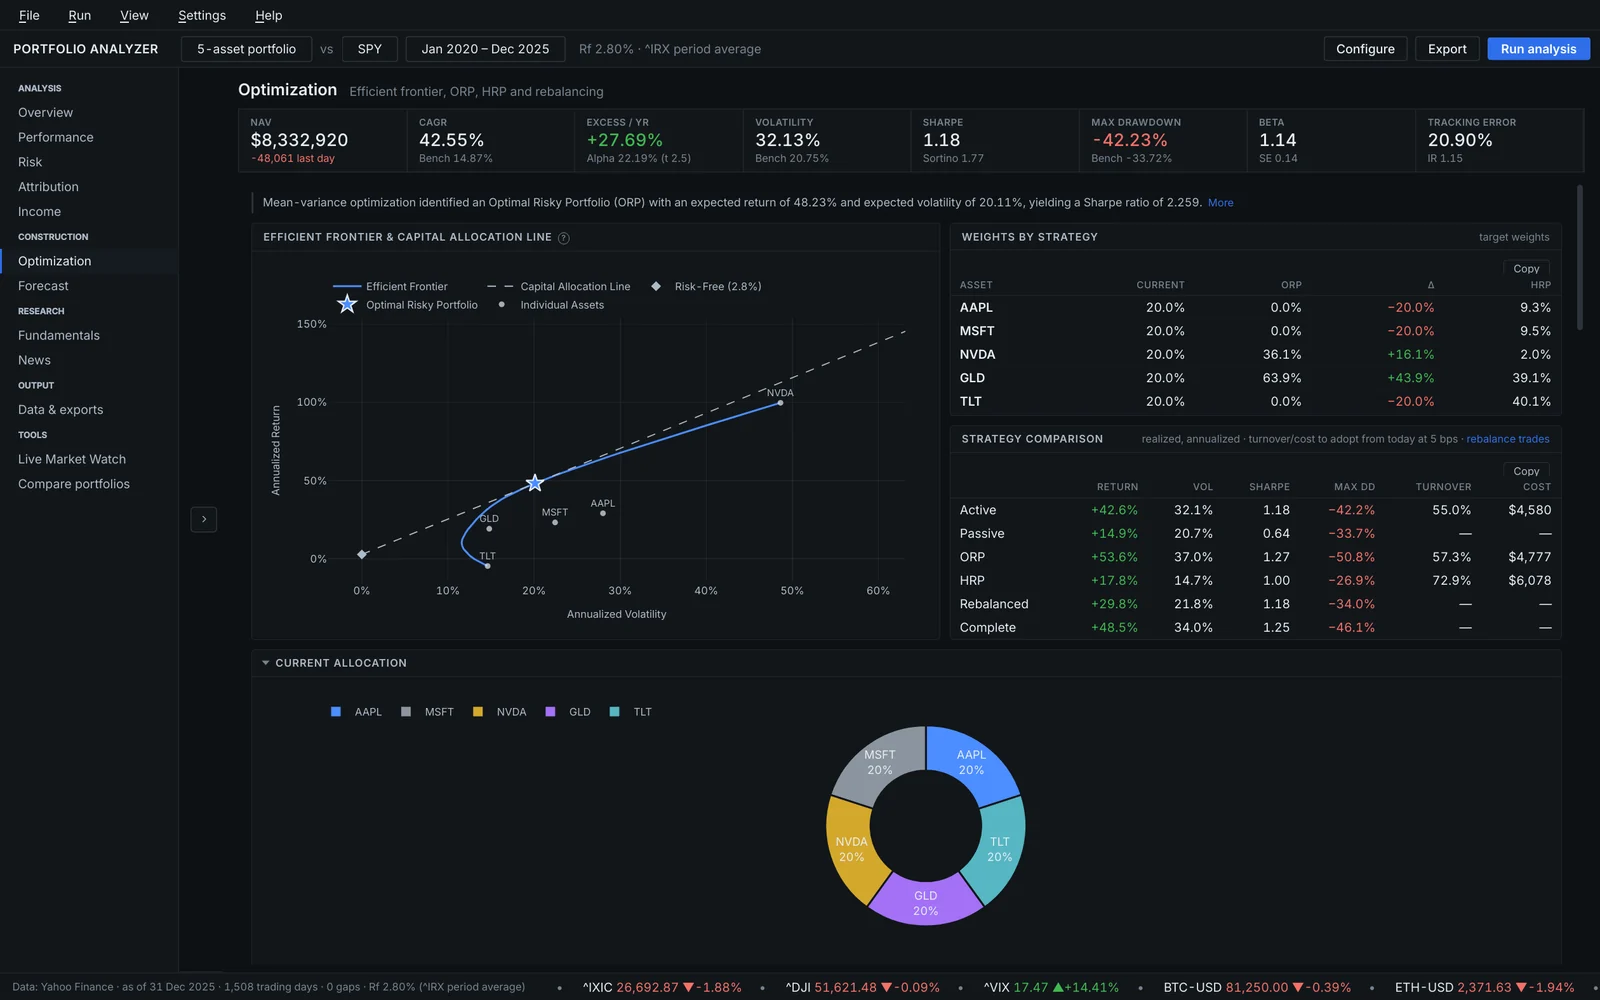
Optimization
Efficient frontier with the capital allocation line, Max-Sharpe and HRP portfolios, and cost-aware rebalance trades.
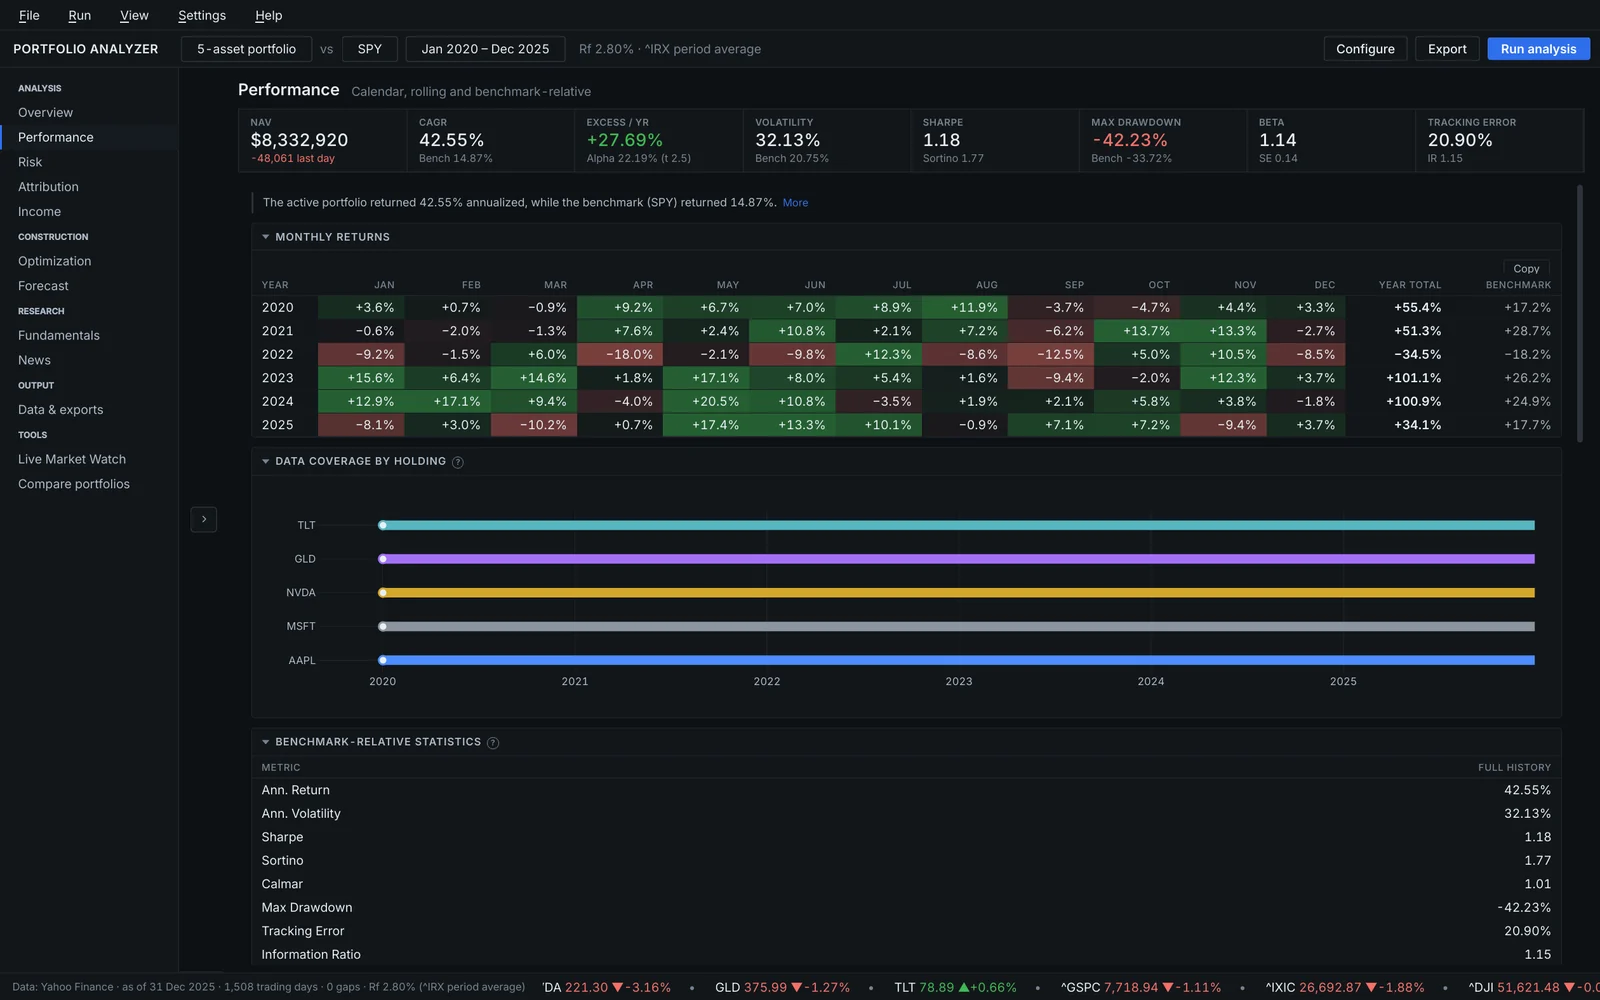
Performance
Capture ratios, tracking error, information ratio and rolling Sharpe over the full and common history.
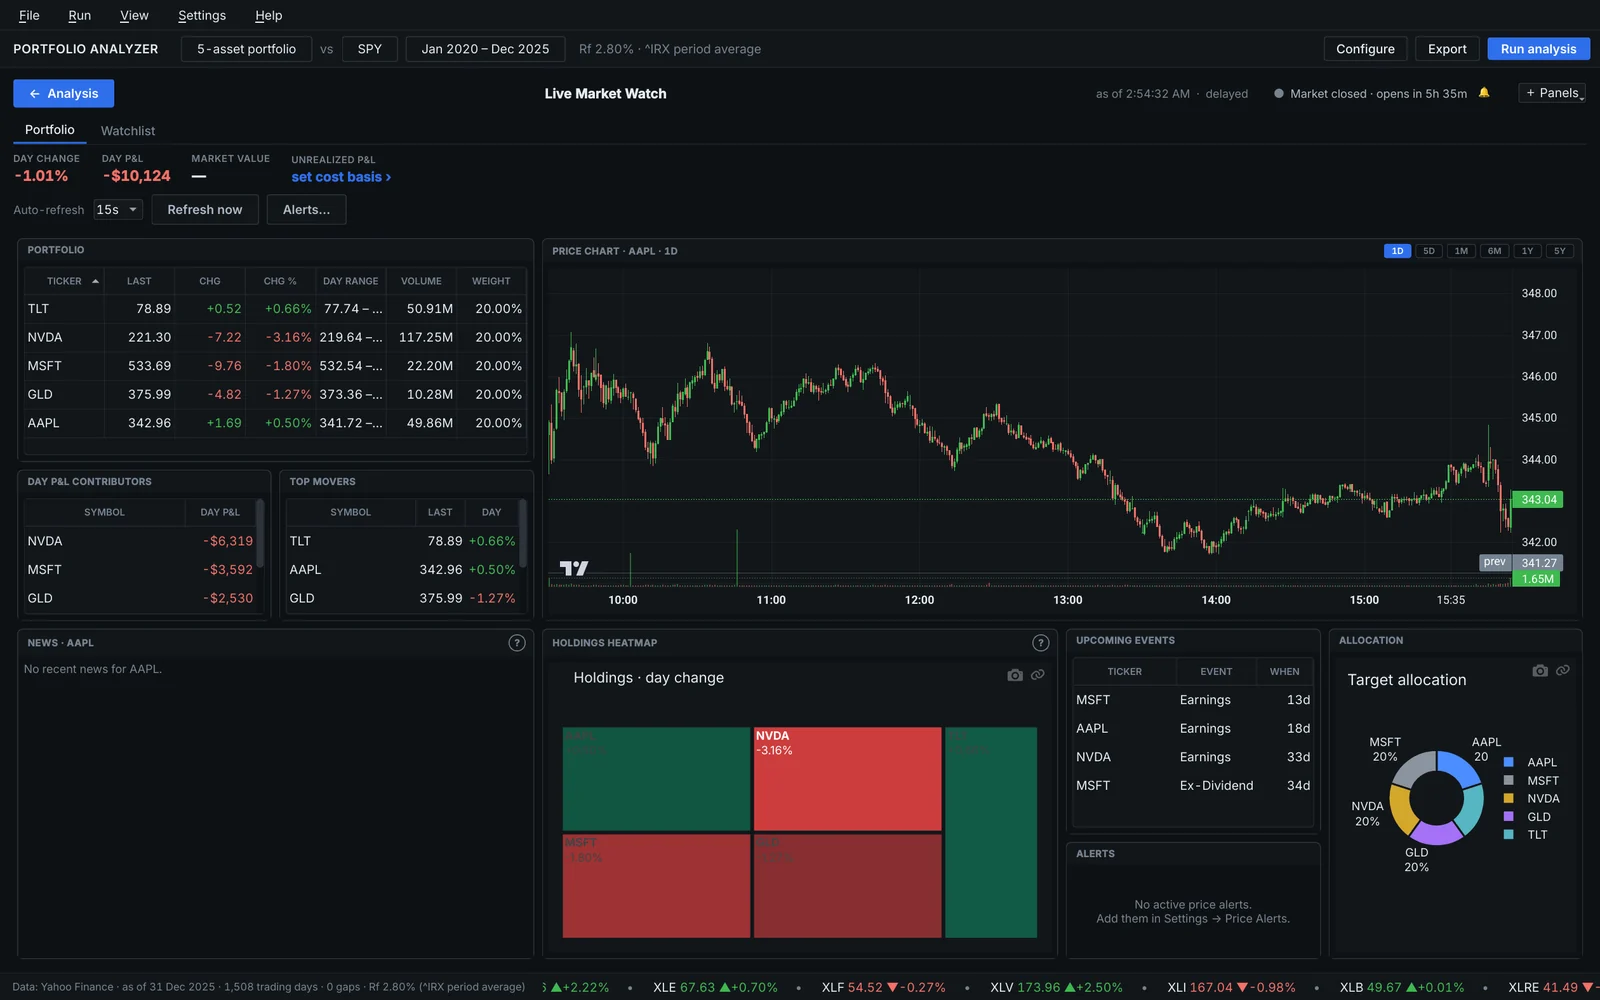
Live Market Watch
A snap-to-grid cockpit of delayed quotes, an intraday chart, movers, day P&L, a heatmap and allocation.