Independent research · Macro · monetary systems · Public information only
Originally written August 2026 · Updated October 2026
The reserve currency does not have to run a trade deficit
Triffin's dilemma was about official dollar claims outgrowing a fixed gold stock, not the trade balance: reserve status enables deficits but does not require them. What survives is a fiscal confidence problem, and a dated income test shows the spread the US earns on its external balance sheet fell below its leverage-driven break-even in 2024.
Spread vs break-even
1.32 vs 1.44pp
2025 · below break-even since 2024
Net primary income
−$47.6bn
2025 · after −$68.7bn in 2024
Net int'l investment position
−$22.42tn
Q2 2026 · ≈ −69% of GDP
Federal net interest
3.20% of GDP
FY2025 · ties the FY1991 record
Independent research written in a personal capacity. Not prepared for, reviewed by, or affiliated with any employer, client or institution. Not investment advice. Every data-derived figure was recomputed from public sources.
Summary
- Triffin never said the reserve issuer must run a trade deficit. His 1959–60 argument was about the official balance of payments and the US gold stock. Official dollar claims were bound to outgrow the gold behind them. Trade is a different account, and keeping the two apart answers most of the question.
- The record contradicts the trade-deficit reading. The United States ran a merchandise trade surplus every year from 1946 to 1970 while it supplied the world’s reserves. Its current account was in surplus in all but three of those years (1950, 1953 and 1959) before the deficits of 1971–72.
- Reserve status allows deficits; it does not compel them. The balance-of-payments identity binds net flows, not gross ones. The world can get dollar assets by selling the United States foreign assets instead of goods. What reserve status does is remove the external financing constraint that disciplines other countries.
- The binding constraint today is fiscal. Federal net interest was 3.2% of GDP in FY2025, matching the 1991 record. Debt held by the public is about 98–100% of GDP, and the CBO projects 120% and net interest of 4.6% of GDP by 2036. Foreign official holders now own about 41% of foreign-held Treasuries, down from 43% a year earlier, and roughly 12% of all federal debt held by the public.
- A dated test of the privilege. The United States earns a higher yield on its external assets than it pays on its liabilities. Because liabilities now exceed assets by about half, the spread has to clear a threshold, yield paid × (liabilities/assets − 1), for net income to stay positive. On the current BEA data, the threshold rose above the measured spread in 2024 (1.57 vs 1.37 percentage points) and stayed above it in 2025 (1.44 vs 1.32) and in both quarters of 2026 (Q2: 1.24 vs 1.14). Net primary income was −$68.7bn in 2024 and −$47.6bn in 2025, the first annual deficits in the modern series.
- What moved the line. Over 2007–2025 rising leverage did most of the work. Since 2019, though, a narrowing spread has contributed as much as rising leverage. About half the post-2007 fall in the net international investment position (NIIP) is valuation, mostly foreigners’ gains on US equities, and half is cumulated deficits.
- The finding has limits, stated up front. The decomposition is standard in the exorbitant-privilege literature; what is new here is presenting it as a dated threshold. The crossing date is robust to how stocks are averaged and to how income is defined. It is not robust to a plausible correction for multinational profit shifting, which inflates measured US receipts.
- Gold and bitcoin are insurance, not replacements. Central banks bought 863 tonnes of gold in 2025 and 345 tonnes in the first half of 2026. In 2025 gold rose about 64%, and bitcoin fell 6.3%. Neither asset can be supplied elastically, which is the property that made the dollar necessary in the first place. The likely outcome is a stratified reserve system, not a new single anchor.
The question
Why is the country that issues the reserve currency not destined to run a trade deficit? The short answer: it never was, and Robert Triffin never said it was. The claim got attached to his name by readers who saw the word “deficit” and assumed it meant trade.
The distinction matters because it decides which variables carry information. If the constraint were trade, the goods balance and the dollar’s real exchange rate would be the things to watch. On the argument below, the constraint is fiscal. It shows up in the interest bill, in who buys Treasuries and at what term premium, and in the income the United States earns on its external balance sheet.
The rest of the piece runs as follows. Section 2 sets out Triffin’s actual claim. Section 3 checks it against the Bretton Woods record. Section 4 explains why reserve status does not mechanically require trade deficits, and where the behavioral and capital-account arguments still bite. Section 5 sets out the fiscal constraint. Section 6 builds and stress-tests a measure of the exorbitant privilege. Section 7 takes the strongest objections at full strength. Section 8 covers gold and bitcoin, Section 9 policy, and Section 10 what would change the view.
What Triffin actually argued
Robert Triffin made the argument to the Joint Economic Committee on 28 October 1959 and developed it the following year in Gold and the Dollar Crisis [1]. Under Bretton Woods the dollar was convertible into gold at $35 an ounce, but only for foreign official holders. American citizens could not hold monetary gold from 1933 until the end of 1974. The other major currencies were pegged to the dollar.
The dilemma ran as follows:
- World trade was growing fast, and growing trade needed a growing stock of reserves.
- Gold production grew slowly and unpredictably, in step with mining rather than commerce.
- The only elastic source of new reserves was therefore dollar liabilities: foreign central banks accumulating claims on the United States.
- Each new official dollar claim was a claim on a fixed US gold stock.
- Eventually official claims would exceed the gold stock. On Bordo and McCauley’s reconstruction they did so around 1964 [2], and at that point the convertibility pledge was no longer credible.
- The issuer then faces two bad options: stop supplying dollars and starve the world of liquidity, or keep supplying them and invite a run.
That is the dilemma: short-run liquidity against long-run confidence. It says nothing about imports exceeding exports. It says America’s promise to pay gold must eventually exceed its ability to pay gold. The deficit Triffin meant was a deficit on the official settlements basis, a net transfer of reserve claims to foreign official holders, and that is compatible with a trade surplus.
Triffin got the mechanism and the outcome right. Nixon closed the gold window on 15 August 1971 [3]. He got two things wrong. He expected the breakdown to be deflationary, and the 1970s were inflationary. He also underestimated how long foreign central banks would keep absorbing unbacked dollars. Bordo and McCauley argue that Bretton Woods was brought down less by Triffin’s mechanism than by US policy, a war and a domestic expansion financed with easy money, and that different policy could have kept the system going considerably longer [2].
The Bretton Woods record
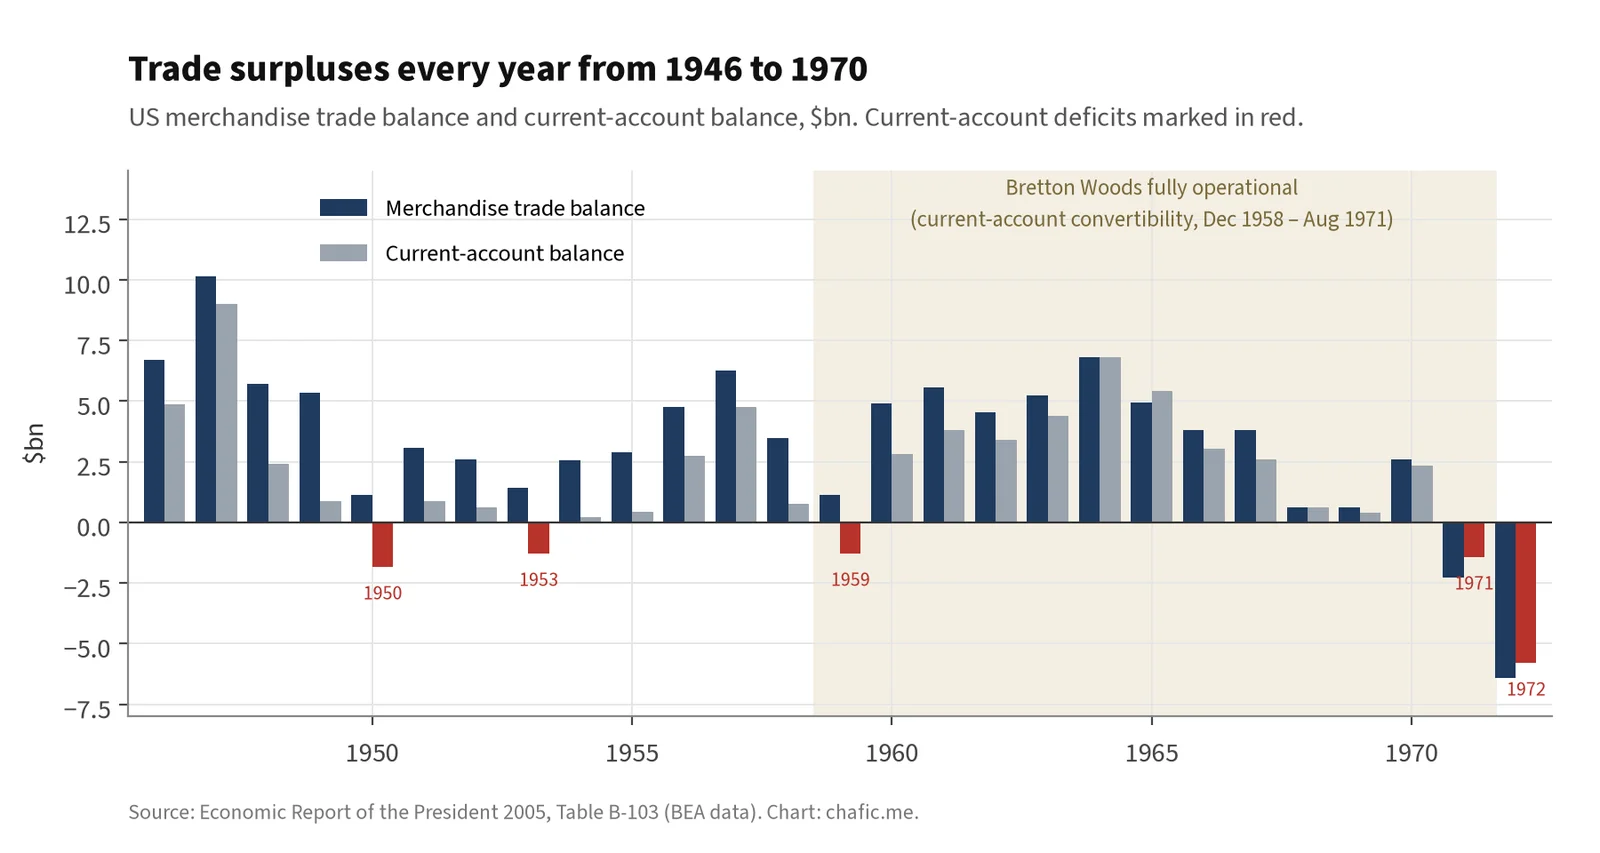
Figure 1. US merchandise trade balance and current-account balance, 1946–1972, $bn. Source: Economic Report of the President 2005, Table B-103 [4].
The historical data are clear, and they need to be stated precisely:
- Merchandise trade was in surplus every year from 1946 to 1970 [4]. The first deficit came in 1971 (−$2.3bn). It is usually described as the first since 1893; I have not independently verified the pre-1946 data behind that date.
- The current account was in surplus in most years, but not all. Using the same table, it was in deficit in 1950 (−$1.8bn), 1953 (−$1.3bn) and 1959 (−$1.3bn), and then in 1971 (−$1.4bn) and 1972 (−$5.8bn), both still within the Bretton Woods period [4][5]. The deficits of the 1950s came from heavy military spending abroad and government grants, not from a goods deficit. The Federal Reserve Bulletin of March 1960 called 1959 “the first annual deficit since 1953” [4]. Across 1946–1970 the current account averaged a surplus of about 0.5% of GDP.
So the accurate statement is that the United States ran trade surpluses every year from 1946 to 1970, and current-account surpluses in almost every year of that period, while supplying the world’s reserves. Dollars reached the world through the capital and official accounts: Marshall Plan transfers, aid, overseas military spending, US multinationals building plants abroad, and US banks lending abroad. On the official-settlements basis the United States was in deficit for much of the period, because foreign official holders were accumulating dollar claims. That was Triffin’s deficit, and it coexisted with a trade surplus.
Two dating points are worth correcting because they strengthen the case. The dollar overtook sterling as the leading reserve currency around the mid-1920s, a generation before Bretton Woods. Sterling regained the lead after the 1933 devaluation and held it into the early 1950s, partly because of British exchange controls [44]. And Bretton Woods was fully operational for only about twelve years. Major European currencies became convertible on current account only at the end of December 1958, and the gold window closed in August 1971 [7]. The dollar’s reserve role came from deep, elastic US money markets more than from a treaty.
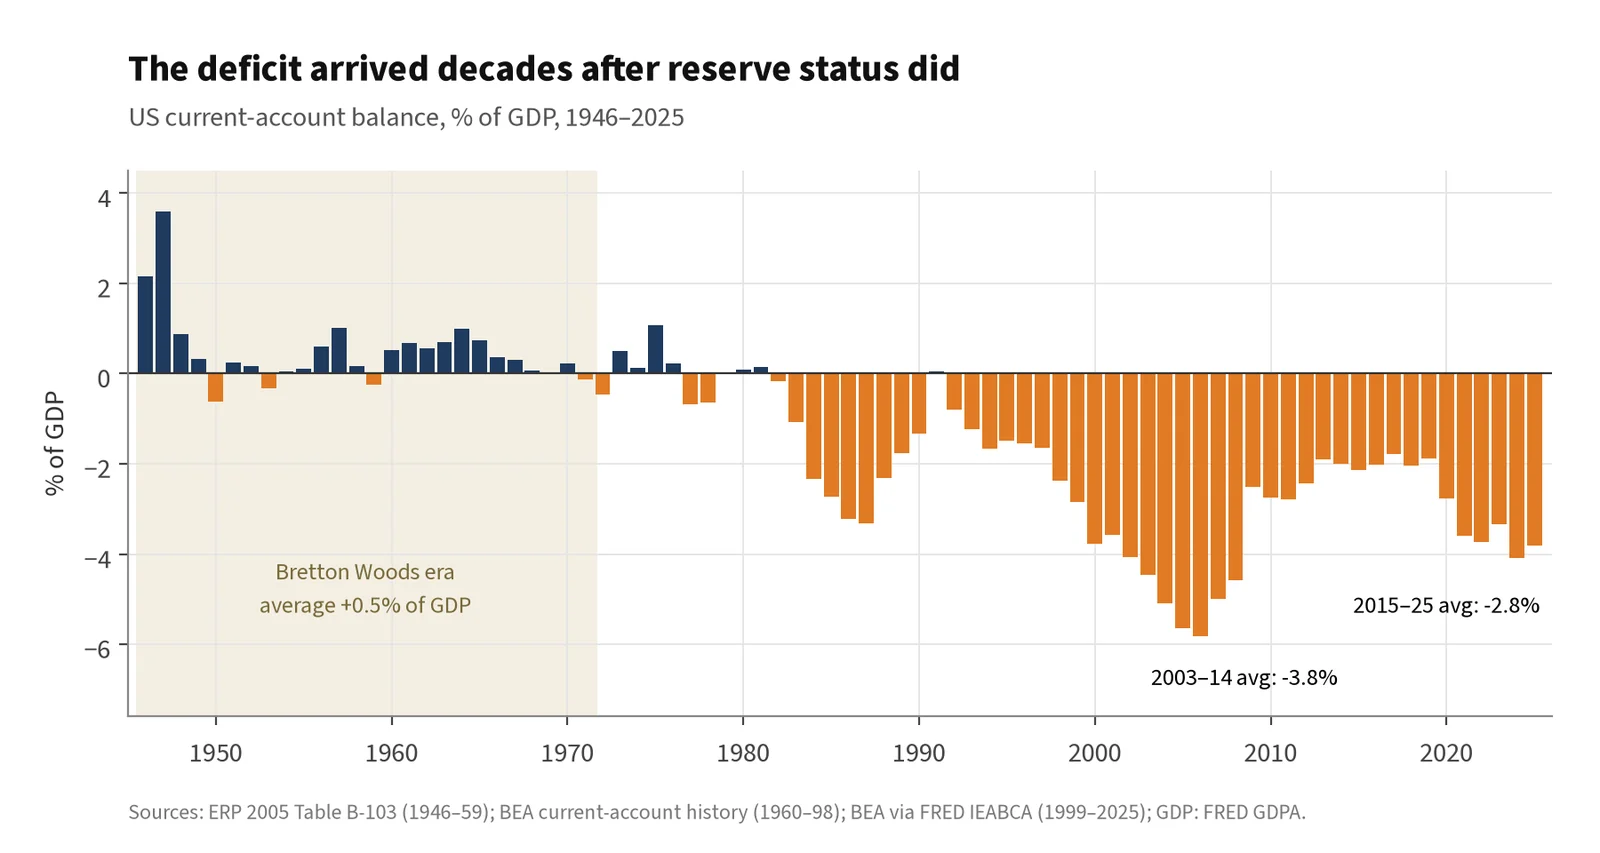
Figure 2. US current-account balance, % of GDP, 1946–2025. Sources: ERP 2005 Table B-103 (1946–59) [4]; BEA current-account history (1960–98) [5]; BEA via FRED IEABCA (1999–2025) [6]; GDP from FRED GDPA.
If reserve status mechanically produced trade deficits, the quarter-century when the dollar’s position was least contested should have produced the biggest ones. It produced surpluses. The current account has been in deficit every year since 1977 except 1980–81 and 1991, when Gulf War transfers produced a surplus, and continuously since 1992. Deficits averaged −3.8% of GDP in 2003–2014 and −2.8% in 2015–2025 (my calculation from [5][6]).
Why reserve status does not mechanically require trade deficits
4.1 The accounting argument: gross is not net
The intuition that reserve status requires a deficit starts from an identity. Ignoring the capital account and the statistical discrepancy:
current account + net financial inflows = 0
If foreigners are net accumulators of claims on the United States, the identity forces a matching current-account deficit. The identity is true, but it binds only net flows. “Foreigners want to hold dollar assets” is a statement about gross demand for one asset class.
Maurice Obstfeld puts it simply: the United States can “import foreign assets rather than foreign products” [8]. Suppose a foreign central bank wants $10bn of Treasuries. It can get them by selling the United States $10bn of goods, which is a trade deficit. Or it can sell the United States $10bn of foreign assets, in which case both sides of the US external balance sheet grow and the current account does not move. Gourinchas and Rey call this the shift “from world banker to world venture capitalist”: the United States issues safe, liquid, low-yielding liabilities and holds riskier, higher-yielding foreign assets [9]. The reserve function is carried out on the liability side. Whether the United States also buys foreign assets is a separate decision, and that is the decision that changed after 1980.
One definitional point completes the argument. Any net accumulation of claims on the United States by foreign officials is, by construction, a US deficit on the official-settlements basis. Supplying reserves does entail an external deficit of that kind. The claim defended here is the narrower one that matters for trade: reserve supply does not entail a current-account deficit.
4.2 The behavioral argument: the price channel
The serious case for a link is about prices, not accounting. Stephen Miran argued in November 2024, while at Hudson Bay Capital and before serving as Chairman of the Council of Economic Advisers and briefly as a Federal Reserve governor, that reserve demand is price-inelastic [10][11]. Roughly $7tn of official reserves forms a bid for dollars that does not respond to fundamentals. On his argument, that bid holds the currency above its trade-clearing level and handicaps US tradables.
This is a relative-price argument, and it is harder to dismiss than the accounting version. A persistently strong dollar does erode export competitiveness. The best rebuttal is empirical (Section 4.4): new official accumulation dried up after 2015, and the deficit did not close. That rebuttal reaches the flow of new reserve purchases but not the stock. The existing stock of official dollar reserves was rolled over throughout, and a standing, stock-based bid is exactly what the overvaluation argument needs. The price channel is therefore best graded as real at the margin, magnitude contested. It is a contributor, not a cause.
4.3 The capital-account-driven argument
The strongest version of the opposing view reverses the causation. In Michael Pettis’s framing, also developed with Matthew Klein in Trade Wars Are Class Wars, surplus economies suppress household consumption and raise national saving [12]. Because global saving must equal global investment, the excess has to be absorbed somewhere. It lands in the deepest and most open capital market. Bernanke’s “global saving glut” and Dooley, Folkerts-Landau and Garber’s “Bretton Woods II” belong to the same family [13]. On this reading the United States does not choose its saving rate on its own. It absorbs the residual: the capital account drives the current account, and the trade deficit, low saving and debt build-up are all symptoms of being the world’s capital sink.
I take this seriously and return to it in Section 7.1. Note for now what it is actually about: open capital markets and financial depth, which go with reserve status but are not the same thing. The United States could tax or restrict inflows, as Pettis has proposed, and keep the reserve role. On his own logic the deficit is a policy equilibrium, not a necessity of reserve issuance.
4.4 The link has already broken in the flow data
Bordo and McCauley compare two decades [14]. In 2003–2014, foreign official inflows averaged about 2.5% of US GDP against a current-account deficit of about 3.9%, so they financed roughly two thirds of it. In 2015–2024 official inflows fell to about 0.16% of GDP, while the deficit persisted at about 2.8%. My own calculation of the current-account averages from BEA data is −3.8% and −2.8% (the second through 2025) [5][6], in line with theirs.
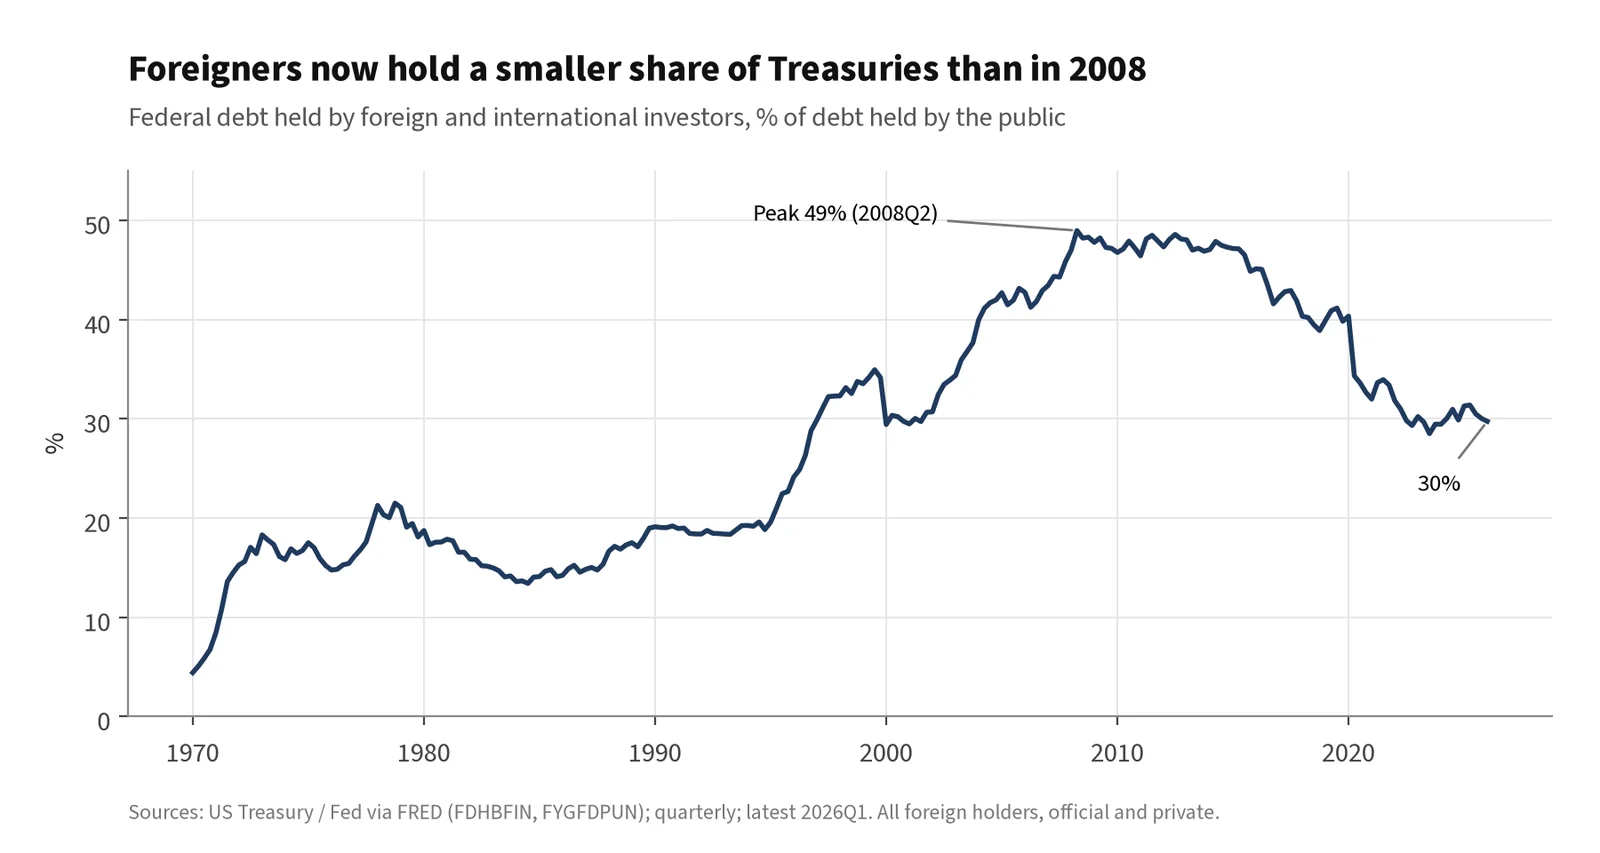
Figure 3. Federal debt held by foreign and international investors, % of debt held by the public. Source: FRED (FDHBFIN, FYGFDPUN) [20].
The stock data tell the same story. The foreign share of federal debt held by the public peaked at about 49% in Q2 2008 and was about 30% in Q1 2026 [20]. Within foreign holdings, official holders’ share fell to 40.8% in July 2026 from 42.7% a year earlier (TIC: $3,773bn of $9,248bn) [19]. Foreign official holdings now amount to roughly 12% of the $31.7tn of debt held by the public (my calculation from [19][20]).
If official reserve accumulation drove the deficit, the deficit should have closed when accumulation stopped. It did not. That is about as close to falsifying the flow version of the reserve-cause claim as open-economy macroeconomics gets. But the episode proves less than it seems to. The financing changed hands, from official buyers to private ones, so the test separates official from private demand. It does not separate demand-driven deficits from saving-driven ones, and it leaves the Pettis view intact.
4.5 Dollar liquidity that never touches the US trade balance
- Eurodollars. From the late 1950s, banks outside the United States created dollar deposits outside the US balance of payments. This happened during years when the United States mostly ran current-account surpluses. Two limits apply: offshore dollars settle through US correspondent banks, and reserve managers mainly hold claims on the US government, not offshore deposits. What eurodollars show is that dollar liquidity is decoupled from the US trade balance.
- Swap lines. In 2020 Federal Reserve swap lines with foreign central banks peaked near $449bn outstanding in late May [15]. The dollars were created and extinguished on balance sheets, with no goods and no current-account effect. Swaps are borrowed liquidity, not owned reserves, but a credible backstop reduces the precautionary demand for owned reserves.
- SDRs. Special Drawing Rights are a reserve asset created by ledger entry, with no trade flow anywhere in the process.
4.6 The cross-section
The euro is the second-largest reserve currency, with about 20% of allocated reserves, and the euro area runs persistent current-account surpluses. Japan, issuer of the third- or fourth-largest reserve currency, also runs surpluses. Switzerland runs large surpluses too, but the franc is a minor reserve currency, about 0.2% of allocated reserves [31]. The cross-section is not one-sided: the United Kingdom, whose pound is roughly level with the yen at about 5% of reserves, runs current-account deficits. The fair reading is that reserve issuance is compatible with either sign of current account, which is all the argument needs.
| Proposition | Assessment |
|---|---|
| Triffin’s original dilemma: gold-backed reserve issuance undermines itself | Sound. Borne out in 1971 and resolved by abandoning the peg. |
| “Current-account Triffin”: reserve status mechanically requires trade deficits | False as stated. No accounting necessity. Contradicted by 1946–70 and by 2015–24. |
| Price/absorption channel: reserve and safe-asset demand holds the dollar above its trade-clearing level | Real at the margin, magnitude contested. A contributor, not a cause. |
| Capital-account-driven deficits (Pettis/Klein) | Coherent, partly supported. Concerns open capital markets more than reserve status as such. |
| The new Triffin: the binding constraint is fiscal capacity and confidence | Live and unresolved. The one that matters from here. |
Synthesis. Reserve status enables the deficit; it does not cause it. It removes the external financing constraint that disciplines every other country, which is why no US administration since 1971 has been forced to choose. That is how a country runs four decades of deficits. Valuation then did roughly half the work of getting the NIIP to −$22 trillion (Section 6.4).
The modern constraint is fiscal
With gold gone, what backs the dollar is US fiscal capacity, and the binding constraint is confidence rather than a metal ratio. Farhi and Maggiori call this the “new Triffin dilemma” [16]. The arithmetic is simple. Global demand for safe assets grows with world output. US fiscal capacity grows with US output. The US share of world output has fallen from roughly 40% in 1960 to about 26% in 2024 [45]. The backing shrinks relative to the claims on it, which is structurally what happened to gold.
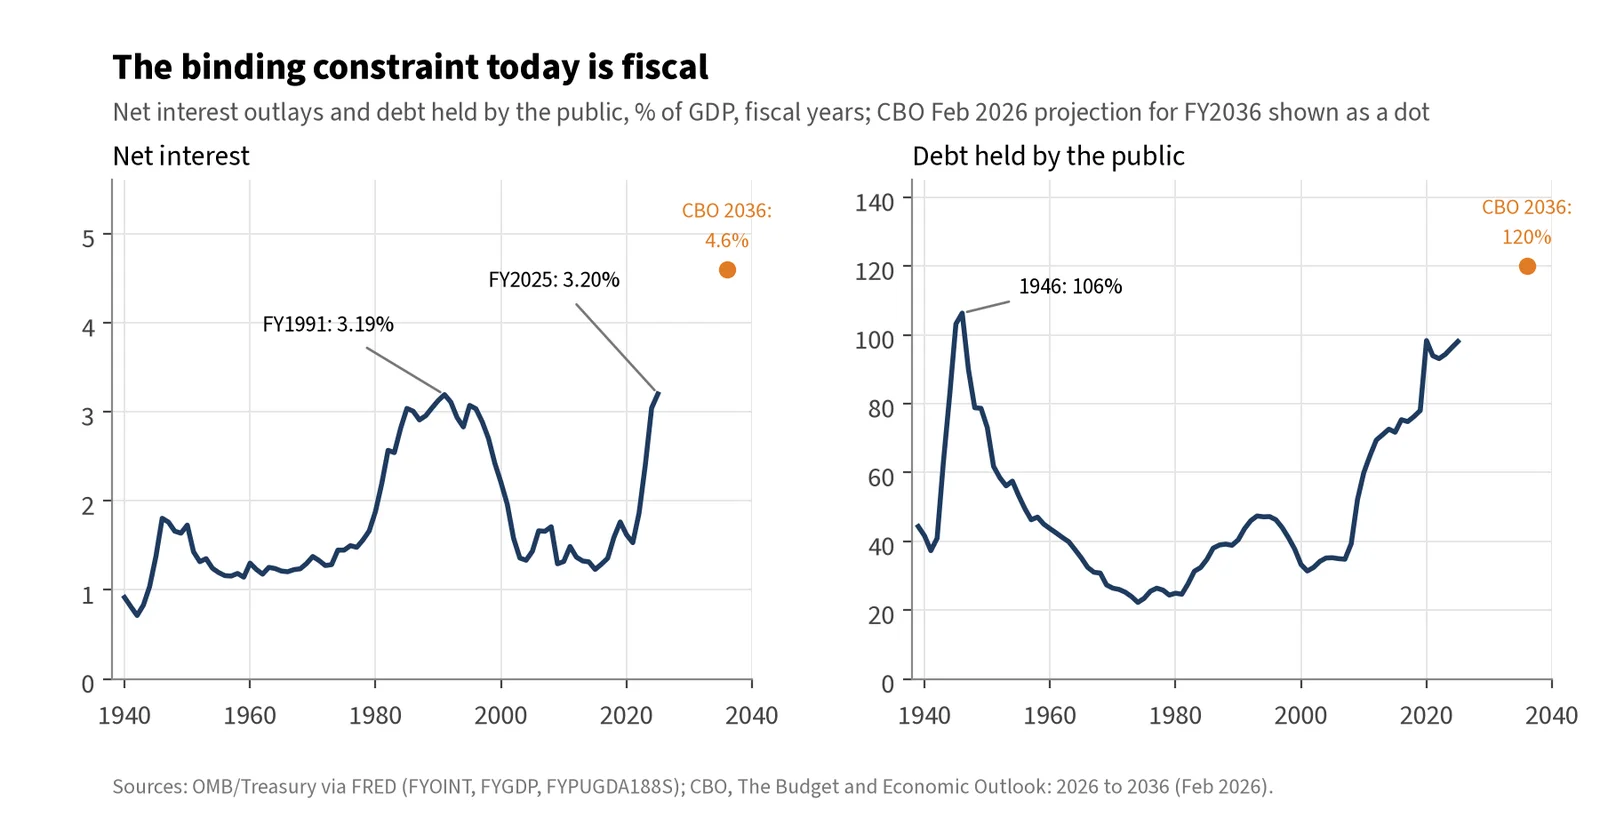
Figure 4. Net interest outlays and debt held by the public, % of GDP, fiscal years. Sources: FRED (FYOINT, FYGDP, FYPUGDA188S) [18]; CBO February 2026 baseline [17].
| Measure | Level | As of / source |
|---|---|---|
| Net interest outlays | $970bn, 3.20% of GDP, matching the FY1991 record of 3.19% | FY2025; Treasury/OMB via FRED [18]; CBO [17] |
| Federal deficit | $1.77tn (≈5.9% of GDP) | FY2025; FRED FYFSD [18] |
| Debt held by the public | ≈98–100% of GDP (OMB/FRED 98.1%; CBO 99.4%) | End-FY2025 [17][18] |
| CBO projection, 2036 | Debt 120% of GDP; net interest $2.1tn, 4.6% of GDP | CBO, Feb 2026 [17] |
| Foreign holdings of Treasuries | $9,248bn; official share 40.8% (42.7% a year earlier) | July 2026, TIC [19] |
| UK / Cayman / China holdings | $998bn (+$102bn y/y) / $460bn / $618bn (−$78bn y/y) | July 2026, TIC [19] |
| 10-year / 30-year Treasury yield | 5.19% / 5.52% | 14 Oct 2026, FRED [21] |
| 10-year term premium (Kim–Wright) | 1.07% | 9 Oct 2026, FRED THREEFYTP10 [21] |
| 10-year TIPS yield / breakeven inflation | 2.84% / 2.32% | 14–15 Oct 2026, FRED [21] |
Three points follow.
- The interest burden has caught up with its historical peak. At 3.2% of GDP, net interest matches the 1991 high. Unlike 1991, it is projected to keep rising.
- The buyer base is changing. All recent growth in foreign holdings is private, and much of it is booked in the UK and the Cayman Islands, the usual domiciles of levered relative-value money. Official holders are price-insensitive and sticky; levered private holders are neither. The make-up of foreign demand matters for how stable the funding is, even though it does not determine the size of the current account.
- The fiscal premium is being priced, but not as a credit event. Real yields of 2.8% are not financial repression. And since early August long yields and the dollar have risen together: the 10-year yield rose from 4.69% to 5.19%, the 30-year from 5.22% to 5.52%, and the dollar index from about 100.0 to 102.0 [21][38]. That looks like a rates or growth repricing, not the emerging-market signature of a falling currency alongside rising yields. That is the most awkward fact for an urgent version of this thesis, and it belongs in the presentation.
The income test: a dated measure of the exorbitant privilege
The sections above are synthesis. This one is construction: a measure, computable from public quarterly data, that turns the question “is the privilege eroding?” into something that can be checked.
6.1 Definitions and derivation
Let A and L be US external assets and liabilities at market value (BEA international investment position) [6]. Let Ā and L̄ be the averages of the start- and end-of-period stocks. Let X and M be primary-income receipts and payments (BEA international transactions) [6]. Define:
- yield earned: rA = X / Ā
- yield paid: rL = M / L̄
- the privilege spread: s = rA − rL
- leverage: λ = L̄ / Ā
Net primary income is then
N = X − M = rAĀ − rLL̄ = s·Ā − rL(L̄ − Ā)
so N > 0 if and only if
s > b ≡ rL(λ − 1) (the break-even spread)
and the gap s − b = N / Ā is just net income scaled by assets. With a balanced balance sheet (λ = 1), any positive spread produces net income. The more a country owes relative to what it owns, the wider the spread it needs just to break even.
What is and is not new. This decomposition is standard in the literature [9][22][23][28]. The contribution here is to present it as a threshold series and to date when the threshold crossed the spread. The test cannot detect anything the sign of net income does not already show. What it adds is attribution: whether a deterioration came from the return advantage (s) or from the balance sheet (λ, rL).
6.2 Results
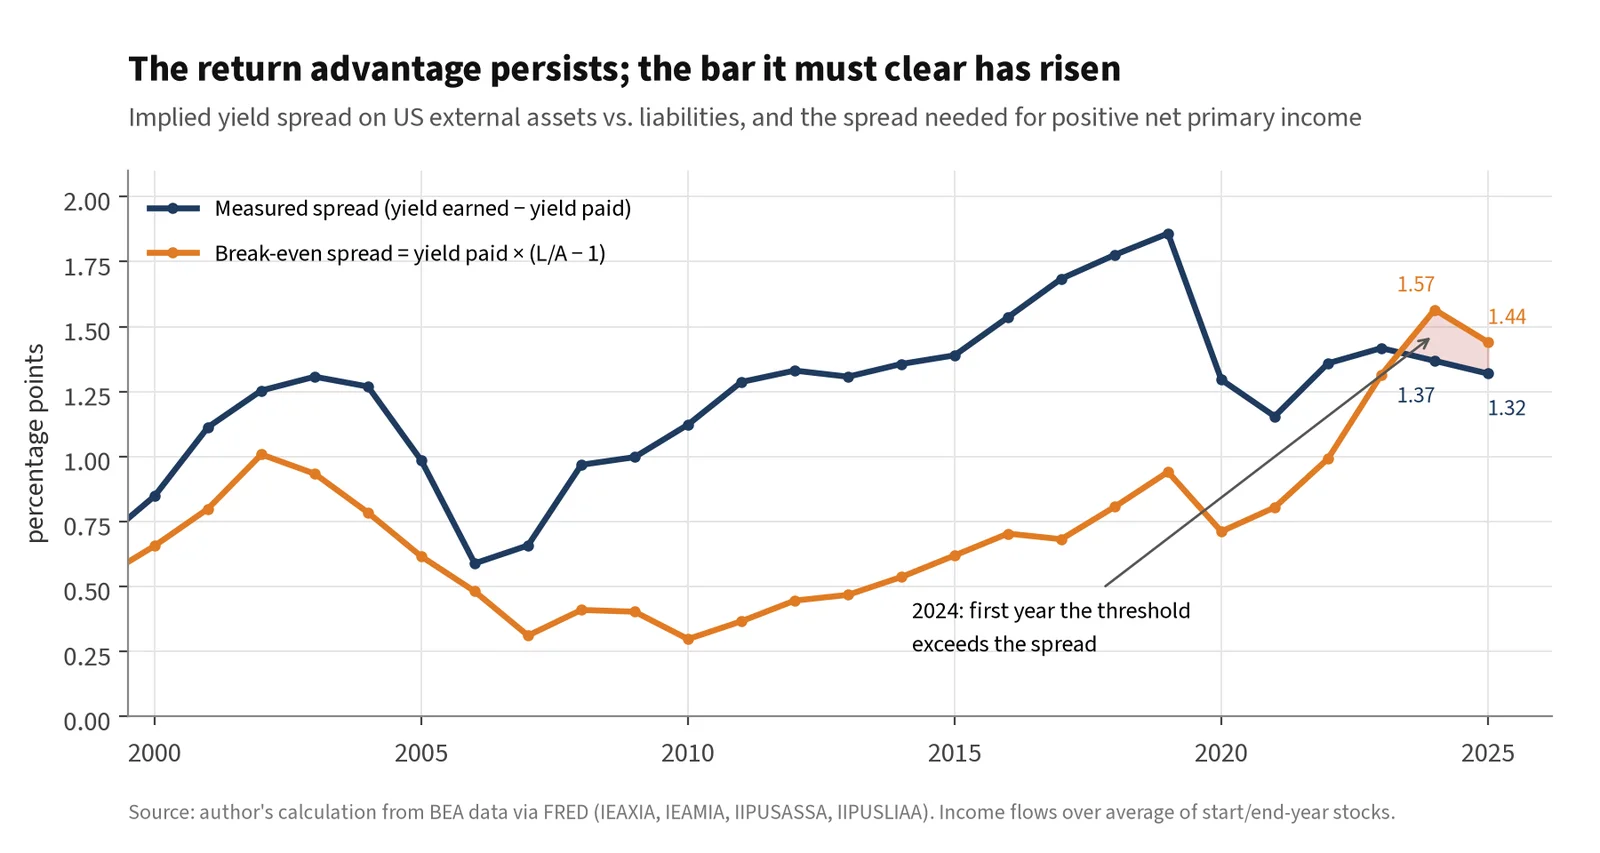
Figure 5. Measured spread vs break-even spread, 1999–2025. My calculation from BEA via FRED (IEAXIA, IEAMIA, IIPUSASSA, IIPUSLIAA) [6].
| Year | Yield earned | Yield paid | Spread | L̄/Ā | Break-even | Net primary income |
|---|---|---|---|---|---|---|
| 2007 | 4.40% | 3.74% | 0.66pp | 1.08 | 0.31pp | +$64bn |
| 2015 | 3.43% | 2.04% | 1.39pp | 1.30 | 0.62pp | +$185bn |
| 2019 | 4.22% | 2.37% | 1.86pp | 1.40 | 0.94pp | +$247bn |
| 2023 | 4.16% | 2.74% | 1.42pp | 1.48 | 1.31pp | +$33bn |
| 2024 | 4.15% | 2.78% | 1.37pp | 1.56 | 1.57pp | −$68.7bn |
| 2025 | 3.89% | 2.57% | 1.32pp | 1.56 | 1.44pp | −$47.6bn |
| 2026 Q1 (ann.) | 3.63% | 2.52% | 1.12pp | 1.50 | 1.26pp | −$15.8bn (qtr) |
| 2026 Q2 (ann.) | 3.69% | 2.55% | 1.14pp | 1.48 | 1.24pp | −$11.4bn (qtr) |
Full annual series in Appendix B. Data: BEA annual update of 24 June 2026 and the Q2 2026 release, retrieved from FRED on 15 October 2026.
Three findings:
- The return advantage persists, but it is not as stable as it is often described. The measured spread ran from a low of 0.59pp (2006) to a high of 1.86pp (2019). It has stayed between roughly 1.1 and 1.9pp since 2010, but it has drifted down since 2019, from 1.86 to 1.32pp in 2025 and about 1.1pp annualized in H1 2026.
- The bar has risen. The break-even spread bottomed at about 0.30pp in 2007–2010 and roughly quintupled to 1.57pp in 2024, as liabilities rose from about 1.1 times assets to about 1.56 times.
- The lines crossed in 2024 and have stayed crossed on an annual basis. In 2024 the threshold (1.57pp) rose above the measured spread (1.37pp), and net primary income posted its first annual deficit in the series, −$68.7bn. It stayed below in 2025 (spread 1.32 vs threshold 1.44; −$47.6bn) and in both quarters of 2026 (Q2: 1.14 vs 1.24; −$11.4bn). Quarterly, nine of the last ten quarters were negative. The exception was Q4 2025, a small positive +$3.4bn. On investment income alone the account was −$46.2bn in 2024 and −$24.9bn in 2025.
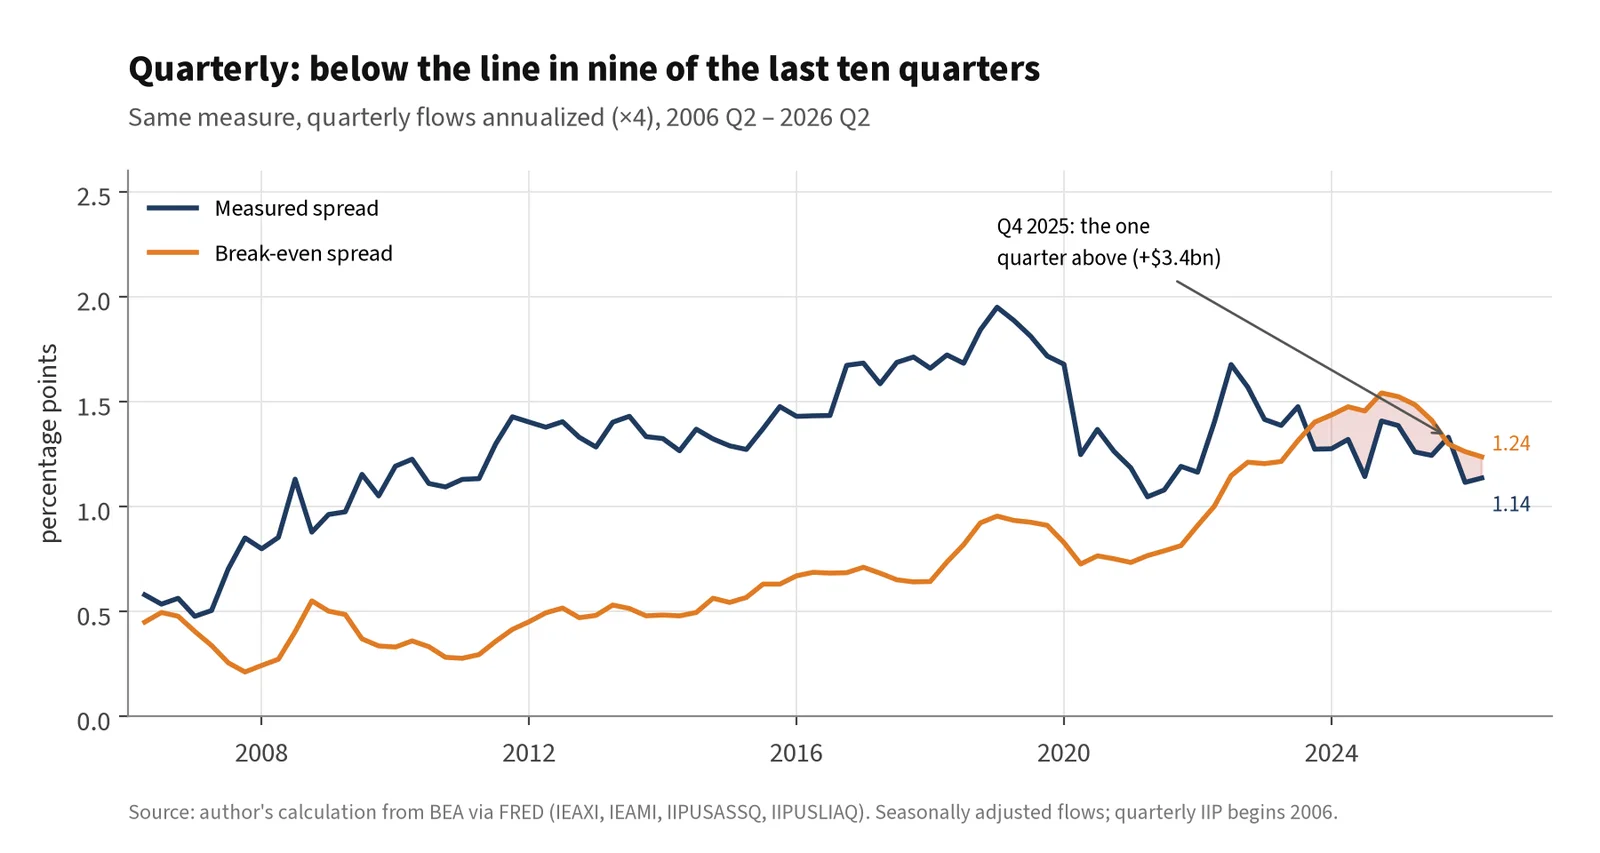
Figure 6. The same measure, quarterly, 2006 Q2 – 2026 Q2. Flows annualized ×4. My calculation from BEA via FRED (IEAXI, IEAMI, IIPUSASSQ, IIPUSLIAQ) [6].
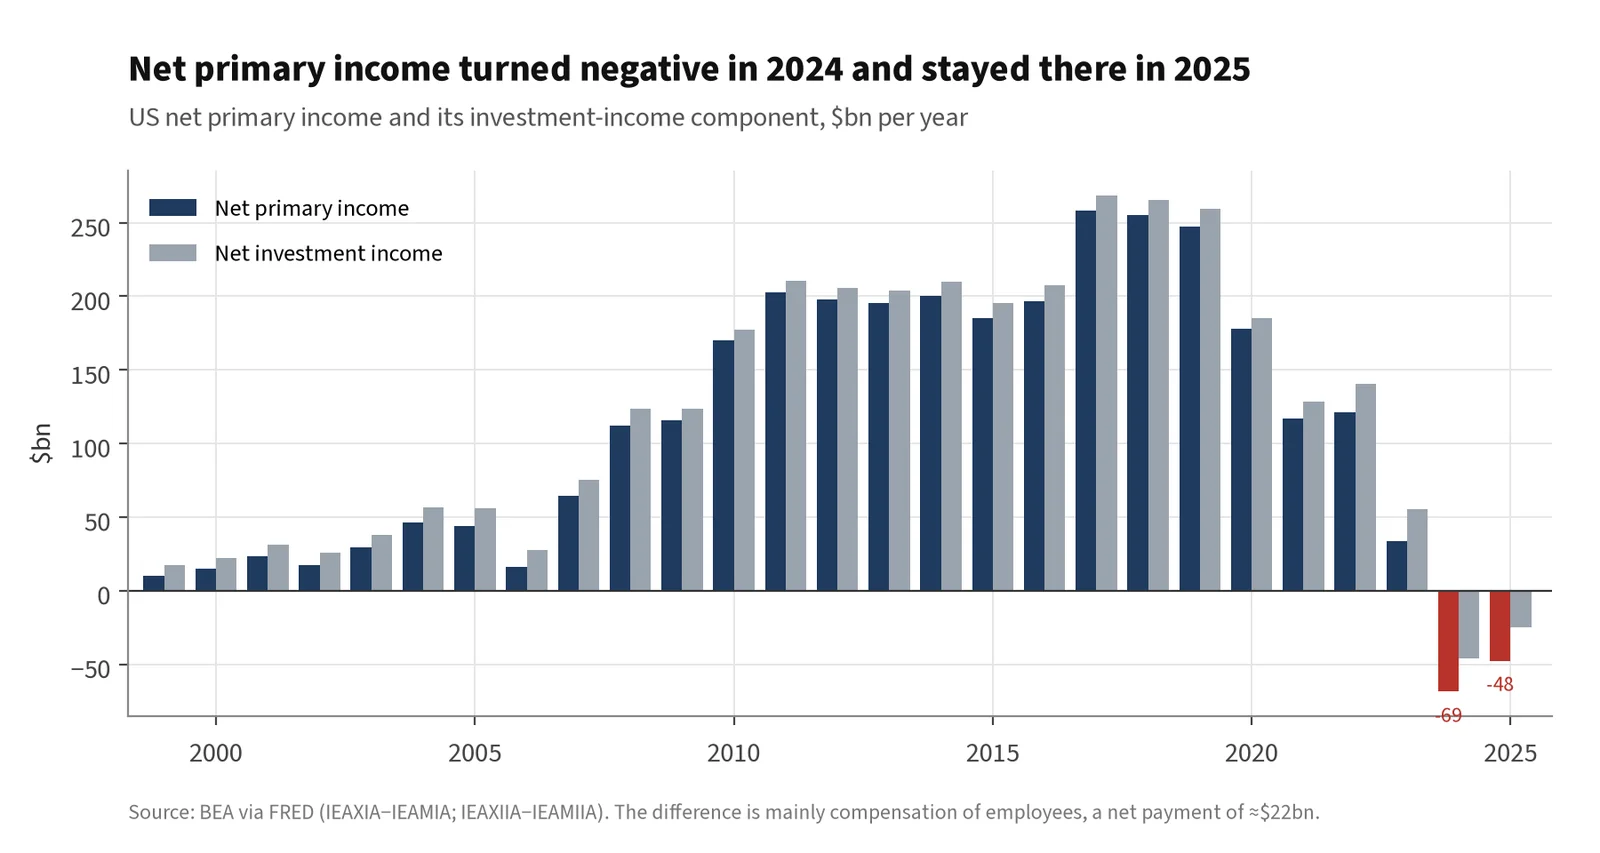
Figure 7. Net primary income and net investment income, $bn per year. BEA via FRED [6].
Compensation of employees. Primary income also includes compensation of employees, which is a small net payment, about −$22bn a year in 2023–2025 (primary minus investment income). Investment income alone is therefore the less negative measure. The crossing holds on either definition.
6.3 What moved the gap: leverage, rates or the spread?
Since gap = s − rL(λ − 1), a change in the gap splits exactly into a spread effect, a yield-paid effect and a leverage effect (midpoint weights; my calculation):
| Period | Change in gap | Spread | Yield paid | Leverage |
|---|---|---|---|---|
| 2007 → 2019 | +0.57pp | +1.20 | +0.33 | −0.96 |
| 2019 → 2025 | −1.04pp | −0.54 | −0.10 | −0.40 |
| 2007 → 2025 | −0.47pp | +0.66 | +0.38 | −1.51 |
Over the full period, leverage is the dominant force. It took 1.5pp off the gap, offset by a wider spread and by lower yields paid. But the final move into deficit after 2019 came about equally from a narrowing spread and from more leverage. A fair summary is that the crossing is mainly a leverage story over two decades, and partly a yield story over the past six years. This is a correction to the earlier version of this note, which called it “a leverage event, not a yield event”.
6.4 Where the leverage came from
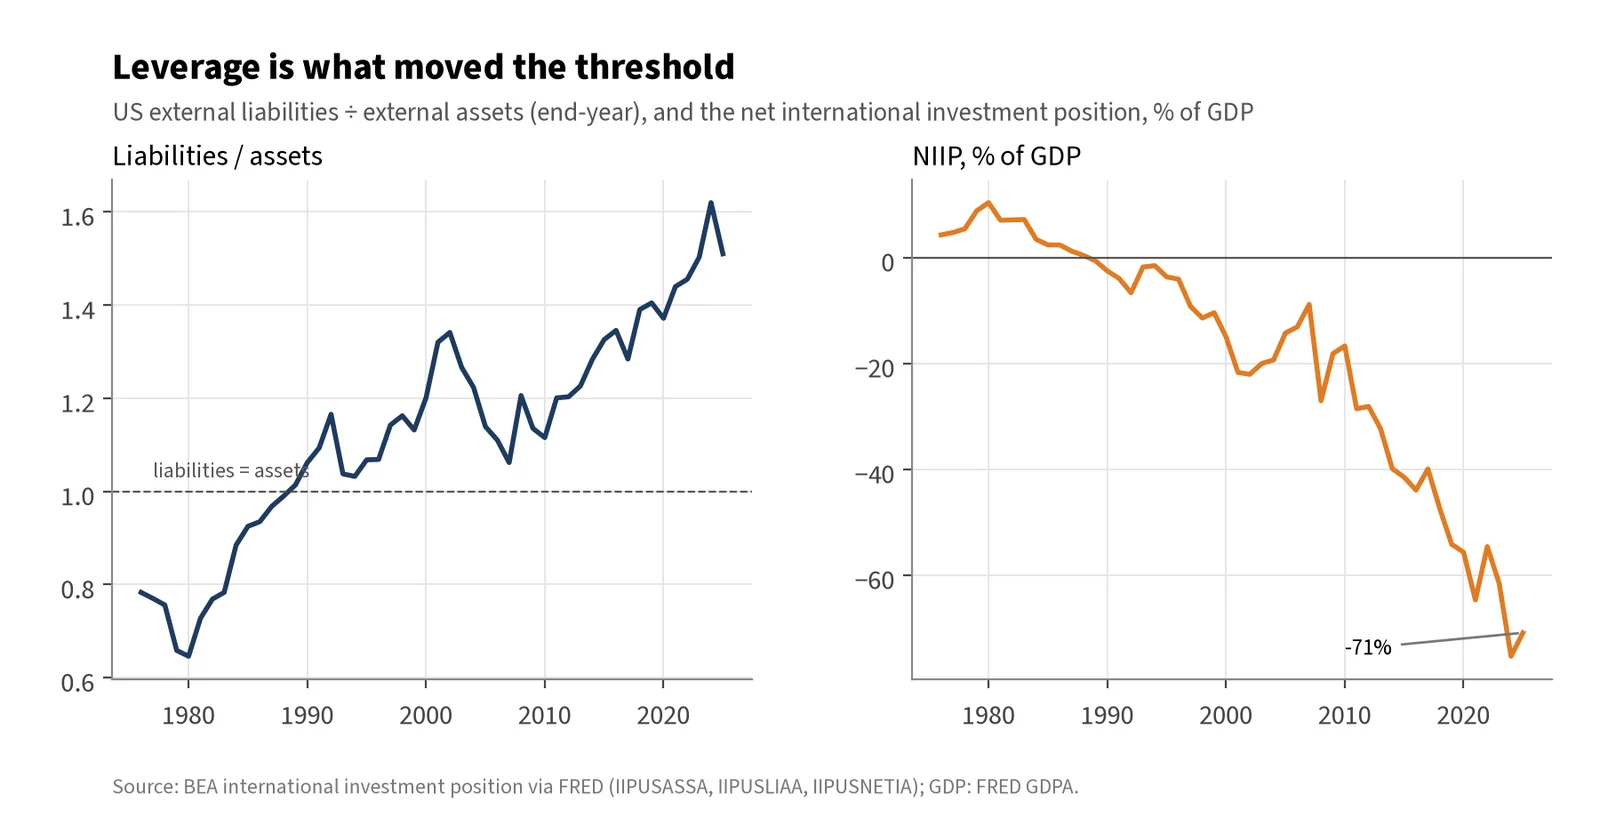
Figure 8. Liabilities ÷ assets (end-year) and NIIP % of GDP. BEA via FRED [6].
US external liabilities were 0.78 times assets in 1976, passed parity in 1989, and stood at 1.51 at end-2025 and 1.48 at end-Q2 2026. The NIIP was −$22.42tn at end-Q2 2026 ($46.97tn of assets against $69.39tn of liabilities), about −69% of GDP [6].
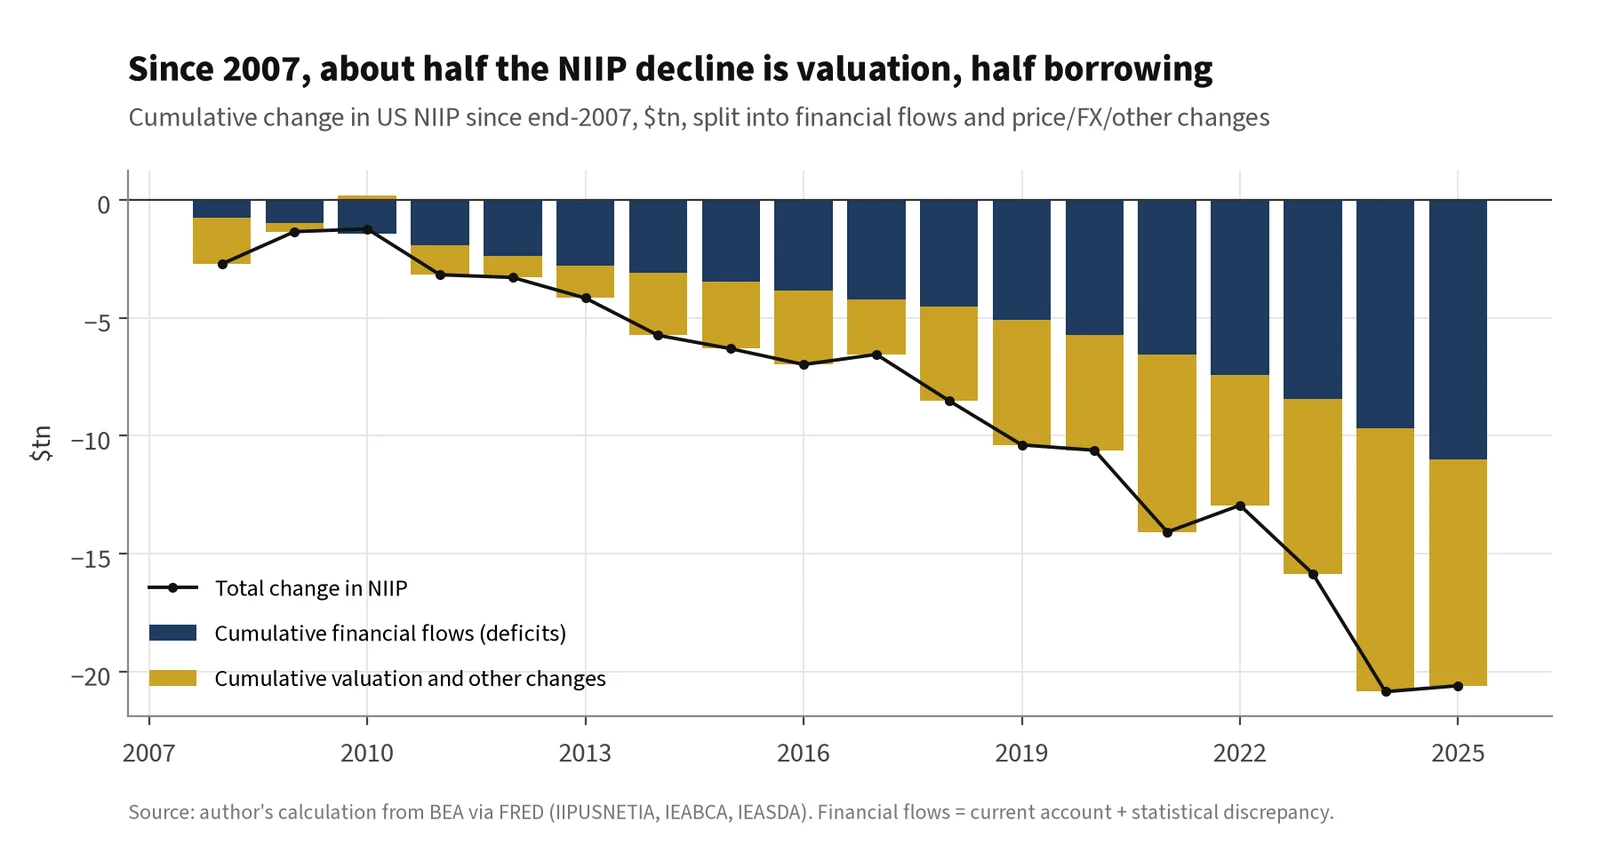
Figure 9. Cumulative change in NIIP since end-2007, split into financial flows (current account plus statistical discrepancy) and price, exchange-rate and other changes. My calculation from BEA via FRED (IIPUSNETIA, IEABCA, IEASDA) [6].
Atkeson, Heathcote and Perri showed that the post-2007 collapse in the US net position was driven largely by valuation [29]. Foreigners hold much of their US exposure in equities, and the long US bull market revalued those claims faster than US holdings abroad. My decomposition supports a qualified version of that claim:
| Window | Change in NIIP | Financial flows | Valuation and other | Valuation share |
|---|---|---|---|---|
| 2007–2025 | −$20.6tn | −$11.0tn | −$9.6tn | 47% |
| 2010–2021 | −$12.8tn | −$5.1tn | −$7.7tn | 60% |
| 2019–2025 | −$10.2tn | −$5.9tn | −$4.3tn | 42% |
Valuation dominated during the 2010–2021 bull market and accounts for about half the decline since 2007. The other half is cumulated deficits. Foreign holdings of US corporate equities rose from about $3.0tn at end-2007 to $22.2tn at end-Q2 2026, about 32% of total US external liabilities (Federal Reserve Z.1 via FRED) [30].
This has an important implication. Because a growing share of the liability side is US equity held by foreigners, the break-even threshold rises when US markets outperform and falls when they sell off. The external income constraint is procyclical to US asset prices: it binds hardest at market peaks and relaxes in drawdowns. That is the reverse of a typical emerging-market external constraint, which tightens in the bust. The configuration that genuinely worsens the external accounts is US equity outperformance combined with high US short rates, which raises the threshold and the yield paid at the same time.
6.5 A consistency check: what keeps NIIP/GDP stable?
Ignoring valuation, the NIIP-to-GDP ratio is stable when the current account equals nominal growth times the NIIP. Take Q2 2026 as given: NIIP −$22.42tn, goods and services balance −2.45% of GDP, secondary income −0.43% of GDP, and a current account of −3.0% of GDP annualized. The net primary income needed to hold NIIP/GDP constant, and the spread it implies, are then:
| Nominal growth (assumed) | Current account consistent with stable NIIP/GDP | Net primary income needed | Spread needed |
|---|---|---|---|
| 3% | −$673bn | +$266bn | 1.83pp |
| 4% | −$897bn | +$42bn | 1.33pp |
| 5% | −$1,121bn | −$183bn | 0.83pp |
At 4% nominal growth the required spread (≈1.33pp) is about 0.2pp above the measured H1 2026 spread (≈1.13pp). This is not an independent test: it restates the break-even condition with the trade balance added. It is useful because it shows how sensitive the conclusion is to nominal growth. Higher nominal growth flatters a debtor, and a slowdown hurts it.
6.6 Sensitivity and assumptions
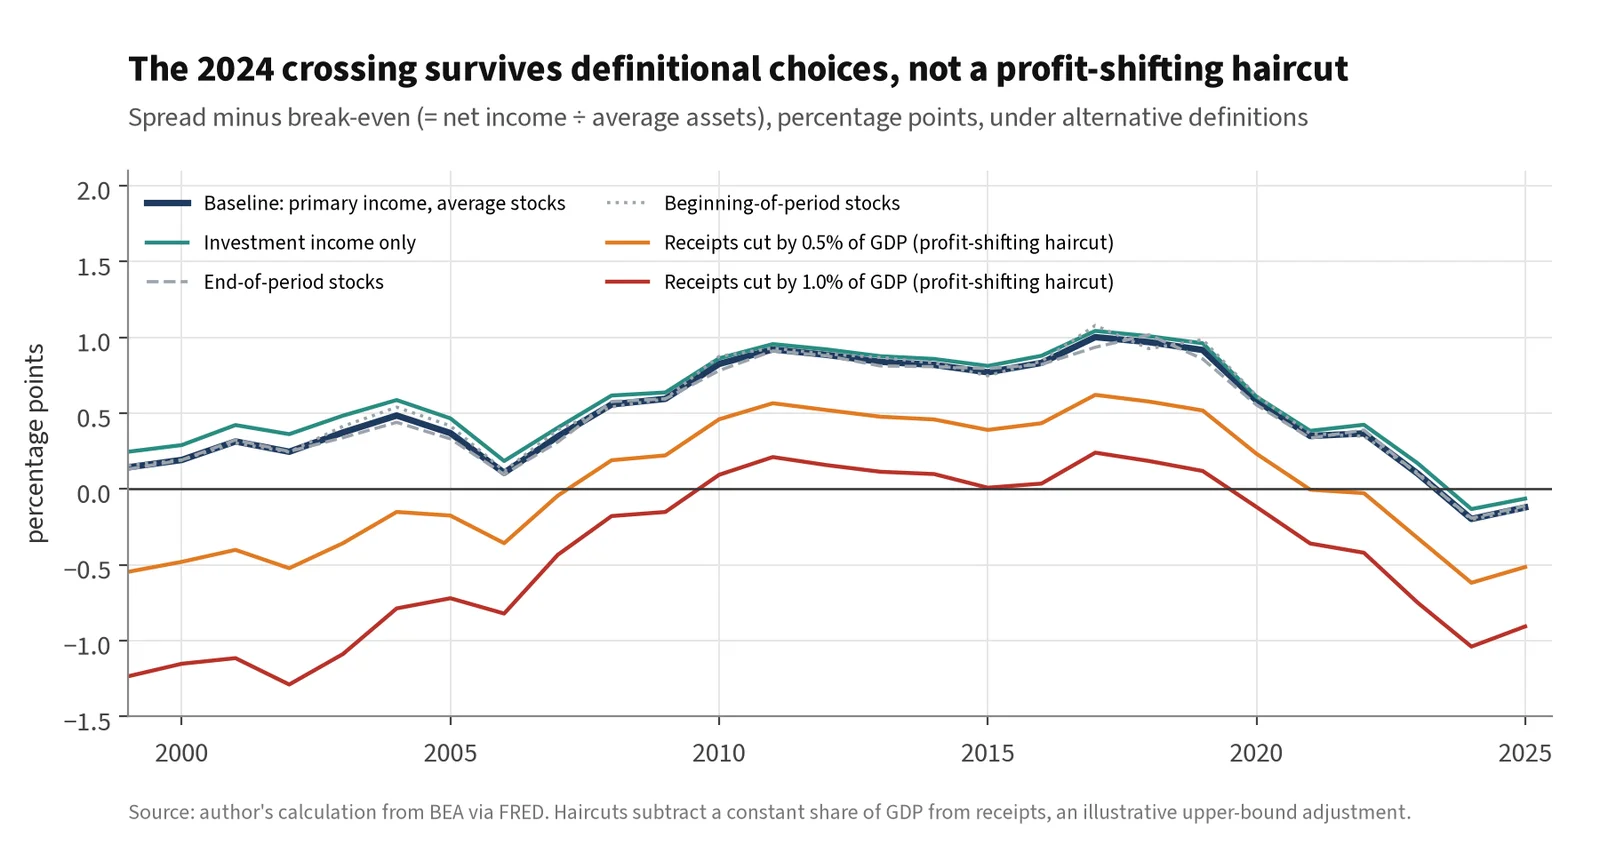
Figure 10. Spread minus break-even under alternative definitions. My calculation [6].
| Variant | Gap 2019 | Gap 2024 | Gap 2025 | Years with negative gap |
|---|---|---|---|---|
| Baseline (primary income, average stocks) | +0.92 | −0.20 | −0.12 | 2024–25 |
| Investment income only | +0.96 | −0.13 | −0.06 | 2024–25 |
| End-of-period stocks | +0.86 | −0.19 | −0.11 | 2024–25 |
| Beginning-of-period stocks | +0.99 | −0.20 | −0.13 | 2024–25 |
| Receipts cut by 0.5% of GDP (profit-shifting haircut) | +0.52 | −0.62 | −0.51 | 1999–2007, 2021–25 |
| Receipts cut by 1.0% of GDP | +0.12 | −1.04 | −0.91 | 1999–2009, 2020–25 |
Break-even spread (pp) as a function of the yield paid and leverage:
| Yield paid \ L̄/Ā | 1.3 | 1.4 | 1.5 | 1.6 | 1.7 |
|---|---|---|---|---|---|
| 2.00% | 0.60 | 0.80 | 1.00 | 1.20 | 1.40 |
| 2.50% | 0.75 | 1.00 | 1.25 | 1.50 | 1.75 |
| 3.00% | 0.90 | 1.20 | 1.50 | 1.80 | 2.10 |
Flagged assumptions.
- A1. Income only. Implied yields use income flows, not total returns. Capital gains, which are central to the Gourinchas–Rey measure of the privilege, are excluded, so the spread understates the full privilege in good years and misses the transfers of bad years (Section 7.5).
- A2. Stock timing. Stocks are averaged over the start and end of each period, and quarterly flows are annualized by ×4. The results are insensitive to this choice (table above).
- A3. Profit shifting. FDI receipts are inflated by multinational profit booking in low-tax jurisdictions [25][26], which biases the measured spread up. The haircut variants subtract a constant share of GDP every year. That is a crude, illustrative bound, since the true distortion has varied over time.
- A4. Decomposition. “Financial flows” means the current account plus the statistical discrepancy. The capital account, typically under $10bn a year, is ignored.
- A5. Vintage. Figures reflect the BEA annual update of 24 June 2026 and the Q2 2026 release, retrieved from FRED on 15 October 2026. Future revisions can move the 2024–26 numbers.
Reading the result. The definitional choices do not change the crossing date. The profit-shifting adjustment does. If receipts are overstated by ½–1% of GDP, the “privilege” in income terms was already negative in the early 2000s and turned negative again earlier in the 2020s. What is robust across every variant is the direction since 2019: the gap fell by about 1pp on every definition.
The strongest objections, and responses
7.1 Pettis and Klein: the capital account drives the current account
The objection. Surplus countries’ suppressed consumption pushes excess saving into US assets. The United States absorbs it through lower saving, higher debt or unemployment. Trade wars are class wars, and the US deficit is the mirror of policy elsewhere [12][13].
Response. Much of this is consistent with the argument here, not opposed to it. (i) It is an argument about open capital markets, not reserve status as such. (ii) The 2015–24 episode, with official inflows gone and private inflows taking their place, is compatible with the Pettis view, so I do not claim it refutes him (Section 4.4). (iii) Where I differ is on the remedy and the binding constraint. If the deficit is imposed from abroad, the coherent fix is a tax on inflows or coordinated rebalancing abroad. If it is generated at home, the fix is fiscal. The interest-burden arithmetic in Section 5 binds either way. A country absorbing the world’s excess saving through federal borrowing still has to service the debt.
7.2 Miran: the stock-based price channel
The objection. Reserve demand is price-inelastic, and a standing ~$7tn bid overvalues the dollar [10].
Response. It is accepted as real at the margin (Section 4.2). The 2025–26 episode is suggestive but not decisive. The dollar index fell 9.4% in calendar 2025 [38]. The current account narrowed from −4.1% of GDP in 2024 to −3.8% in 2025 and about −3.0% annualized in Q2 2026 [6], but tariffs and the unwinding of 2025’s import front-running also shaped that move, so the exchange-rate effect cannot be isolated. What the episode shows is that a large depreciation left the deficit near 3% of GDP, not closed.
7.3 Setser: the “privilege” is partly tax accounting
The objection. Setser has argued for years that much of the US income surplus came from FDI income reported in tax havens, mostly reinvested earnings, rather than from superior returns [25]. Guvenen, Mataloni, Rassier and Ruhl estimate that profit shifting materially understates measured US output and exports and overstates foreign income [26].
Response. This is the strongest live objection to reading the income line as a return privilege, and the sensitivity analysis accepts it: the crossing date is not robust to it. But profit shifting moves income between the trade line and the income line. It does not change the current account or the NIIP arithmetic. If shifted profits were booked onshore, royalties (service exports) would rise and FDI income would fall by the same amount. So for sustainability, the question in Section 5, the objection changes the labels but not the totals. For interpretation it matters a lot: part of the “privilege” was always an accounting convention, and the honest claim is about the trend, not the level.
7.4 Curcuru, Dvorak and Warnock: the differential is a measurement artifact
The objection. Much of the large measured US return differential came from inconsistent revisions to positions and flows. With internally consistent data, the total-return differential falls from about 3.4% to about 1.0% [23]. Later work finds that what remains is concentrated in FDI yields [24].
Response. The measure here is yield-only and uses a single, consistent data vintage, so it avoids the capital-gains artifact that was CDW’s main target. It inherits their second point, though: the residual advantage sits in FDI yields, which is where profit shifting operates (7.3). The two critiques point the same way, and the article treats the spread as an upper bound on the true return advantage.
7.5 Gourinchas and Rey: privilege and duty
The objection. The relevant privilege is in total returns, including capital gains, and it comes with an “exorbitant duty”. In global crises the United States transfers wealth to the rest of the world, about 19% of US GDP in 2007–09, because its liabilities are safe and its assets are risky [28].
Response. These points complement the measure. An income-only spread understates the privilege in good times and misses the duty in bad ones. The procyclicality finding in 6.4 is the same mechanism seen from the income side. Foreign-held US equity makes the external constraint bind at market peaks and relax in busts. In a severe US equity drawdown, the NIIP and the break-even threshold would improve as foreigners take the losses. That is the duty, paid through valuation.
7.6 Hausmann and Sturzenegger: dark matter
The objection. If the United States earns positive net income on a negative measured NIIP, it must hold unmeasured assets (“dark matter”). Capitalizing net income gives the “true” position, which in the mid-2000s was positive [27].
Response. Apply their method to today’s data. Net investment income was −$24.9bn in 2025, so capitalizing it at any positive rate implies a negative economic NIIP. By their own logic, whatever dark matter existed has disappeared. Setser’s reading, that much of it was tax-driven FDI income booking, is the more economical explanation [25].
Gold and bitcoin: insurance, not replacement
8.1 Reserve data
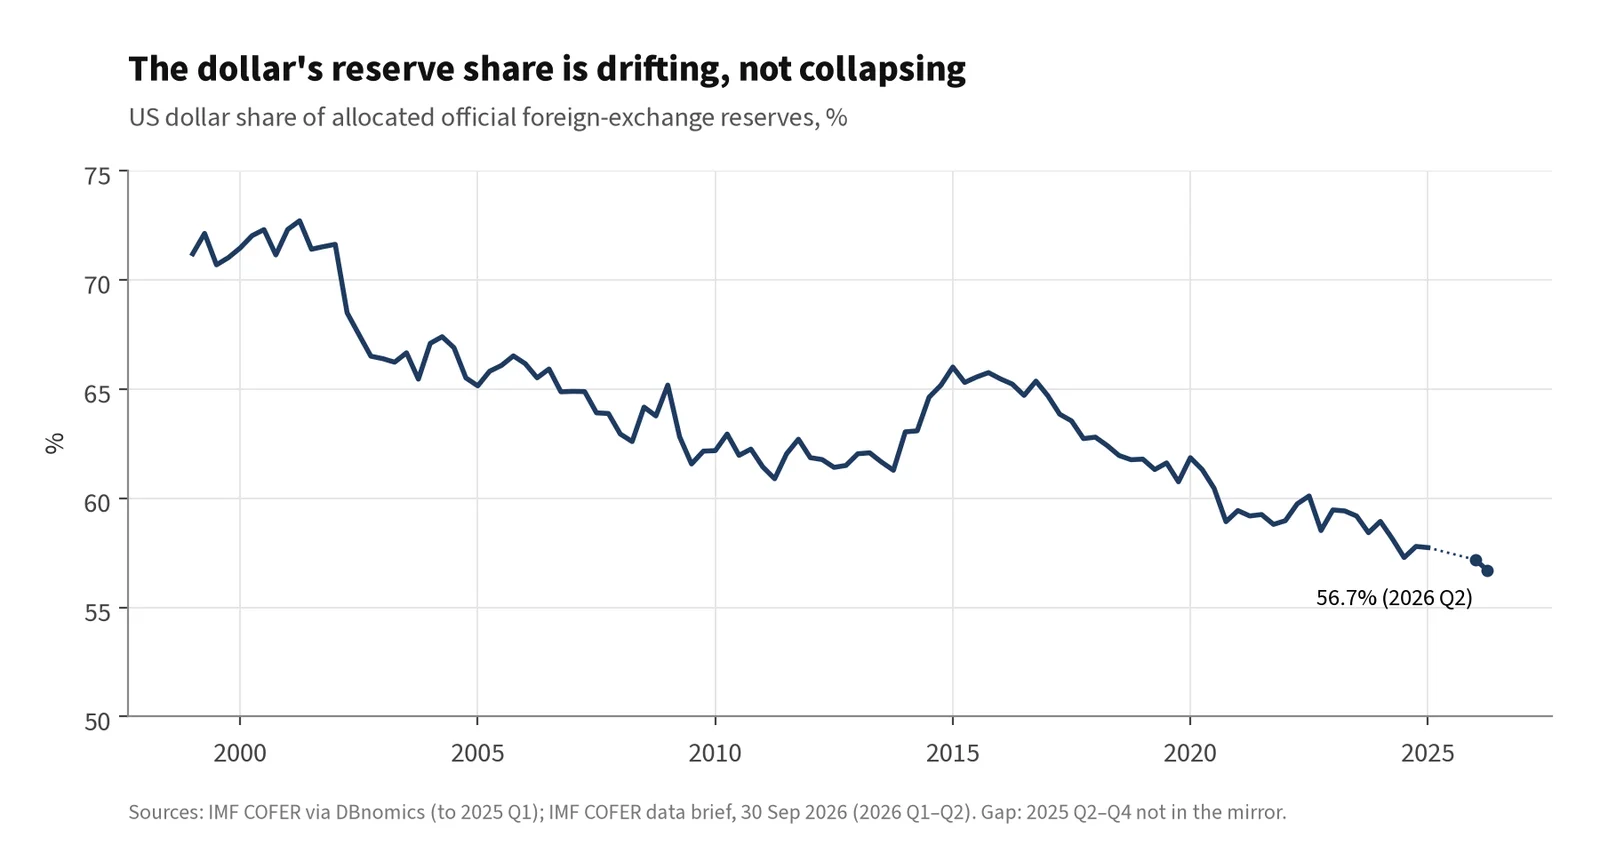
Figure 11. US dollar share of allocated FX reserves. IMF COFER [31].
The dollar’s share of allocated foreign-exchange reserves was 56.7% in Q2 2026, down from 57.2% in Q1 2026 [31]. It was about 71% in 1999 and peaked near 73% in 2001. In the latest full breakdown I could retrieve (Q1 2025) the euro held about 20%, sterling and the yen about 5% each (they swap third and fourth place from quarter to quarter), the renminbi about 2%, and the Swiss franc 0.2% [31]. Total FX reserves were $13.22tn in Q2 2026, so dollar reserves are roughly $7tn. That last figure assumes about 93% of reserves are allocated, as in 2025.
Counting gold changes the picture, mostly through prices. The ECB reported in June 2026 that gold, at market value, had overtaken US Treasuries in global official reserves at end-2025: 27% against 22%, with the euro at 15%. At end-2023 gold prices, Treasuries would be about 26% and gold about 16% [32]. The ranking change is mainly valuation, not reallocation.
8.2 Central-bank buying
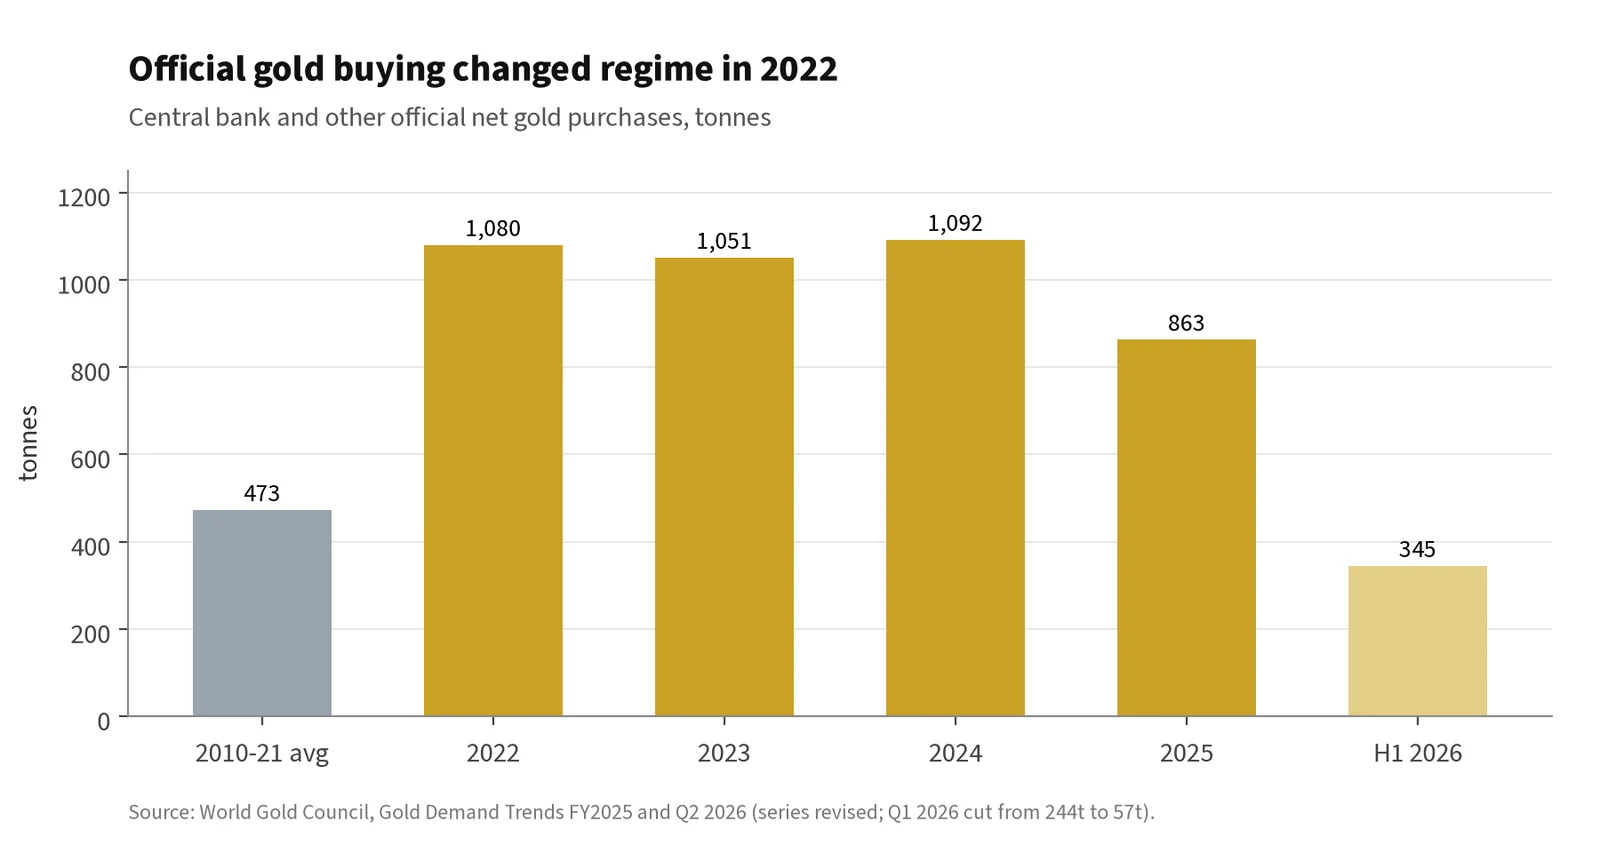
Figure 12. Central-bank net gold purchases, tonnes. World Gold Council [33][34].
Central banks bought 863 tonnes in 2025, below the 1,000+ tonne years of 2022–2024 but about 1.8 times the 473-tonne average of 2010–2021 [33]. In the first half of 2026 they bought 345 tonnes, the lowest first half since 2022, after the WGC revised Q1 down from 244t to 57t. Q2 was strong at 289t [34]. Poland reached 632t by end-June against a 700t target. China reported 2,346t. Turkey and Russia were net sellers [34]. In the WGC’s 2026 survey, a record 45% of central banks intend to increase their own gold holdings, and 89% expect global official holdings to rise [34][35].
The regime break dates to February 2022, when Russian central-bank reserves were frozen. Reserves held as claims on another sovereign can be switched off by that sovereign. Gold in your own vault cannot. That is a counterparty motive, not a Triffin one, but it raises demand for a reserve asset that is nobody’s liability.
8.3 2025: a metals trade, not a crypto trade
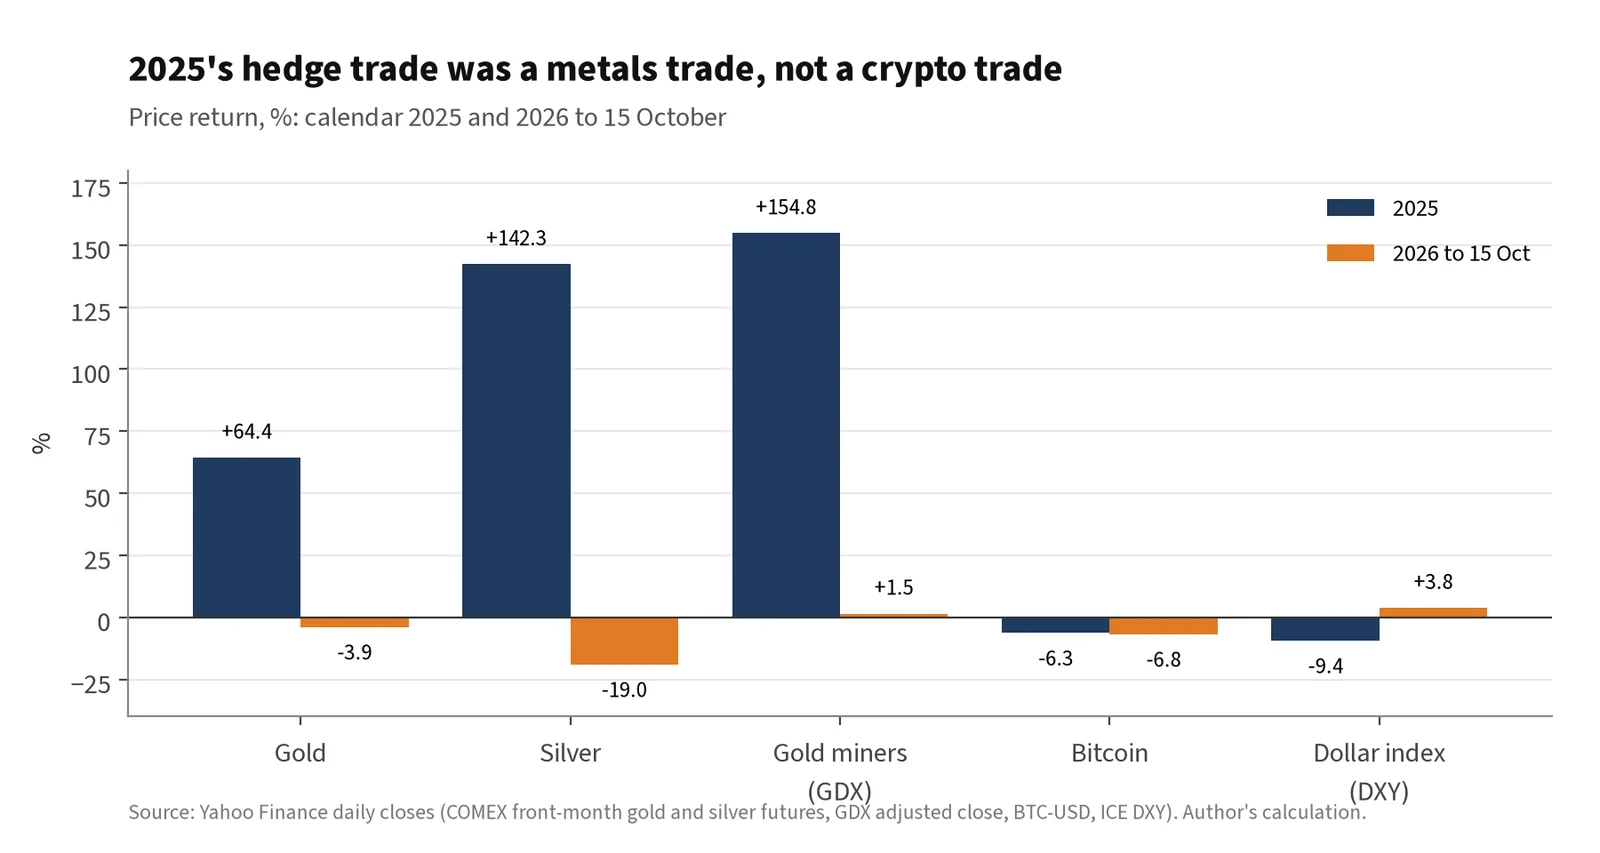
Figure 13. Price returns, calendar 2025 and 2026 to 15 October. My calculation from Yahoo Finance daily closes [38].
| Asset | 2025 | 2026 to 15 Oct | Note |
|---|---|---|---|
| Gold | +64.4% (COMEX front-month); LBMA +62.9%, VanEck +64.6% [37] | −3.9% | Peak $5,318 on 29 Jan 2026 (futures) |
| Silver | +142.3% (COMEX); LBMA +144.8% [37] | −19.0% | About 51% below its January peak |
| Gold miners | GDX +154.8% (total return); MarketVector index +163.2% [37] | +1.5% | |
| Bitcoin | −6.3% | −6.8% | About 35% below its 6 Oct 2025 peak (~$124.8k) |
| Dollar index (DXY) | −9.4% | +3.8% |
The year the debasement thesis was supposed to pay off, it did, but in metals. Bitcoin fell. One year of returns proves little, but it shows the market treating as separate two exposures that the “hard money” narrative still bundles together. Note also the 2026 reversal in metals: the hedge is volatile too.
8.4 Why neither can replace the dollar: the elasticity trap
Gold and bitcoin share one logic: both are attempts to hold a reserve asset that is nobody’s liability. Such an asset avoids the confidence problem completely. But that is only one horn of Triffin’s dilemma. The other is liquidity: the reserve stock has to grow with world commerce. Gold’s above-ground stock (about 219,891t at end-2025) grows by about 1.6% a year from mine supply of about 3,600t [36]. Bitcoin’s supply is capped at 21 million by design. Neither can be supplied elastically.
Floating prices soften this. An inelastic quantity can be accommodated by revaluation, which is what happened to gold in 2025. What a floating, hard-capped asset still cannot do is act as the settlement and funding medium of world commerce, which needs supply that expands with demand at a broadly stable price. Put as a trilemma (offered as a conjecture, building on Mehrling’s “hierarchy of money” [46]): a settlement asset cannot at once have supply outside any issuer’s discretion, a stable price against goods, and supply that grows with gross settlement needs. Gold under Bretton Woods failed on the third. The fiat dollar gives up the first and lives on confidence. Bitcoin keeps the first and gives up the second.
8.5 The US Strategic Bitcoin Reserve: holder, not accumulator
Executive Order 14233 (6 March 2025) created a Strategic Bitcoin Reserve funded with forfeited coins [39]. Estimates of the holdings range from about 198,000 BTC (coins in the reserve proper) to about 328,000 BTC (all government-linked wallets, including coins in pending forfeiture cases) [41]. The gap is definitional, and neither figure is an audited official disclosure I could verify. There have been no purchases. On 14 August 2025 Treasury Secretary Bessent said “we’re not going to be buying that”, then qualified it the same day to leave budget-neutral acquisition open [40]. The BITCOIN Act, which would mandate 1m BTC over five years, has not been enacted [42].
The structural obstacles go beyond volatility. Depth: at about $81,600, and assuming roughly 19.93m coins outstanding, bitcoin’s market capitalization is about $1.6tn, less than a quarter of official dollar reserves. Correlation: bitcoin has traded as a high-beta risk asset, not a hedge. Backstop: there is nobody to call in a crisis. For now the United States holds bitcoin it has seized; it is not building a monetary reserve.
The likely outcome is stratification. Dollars stay in the transactional and liquidity tranche, where depth and elasticity are indispensable. Gold sits in the insurance tranche, where having no counterparty is the whole point. Dollar stablecoins, which are backed by Treasury bills, extend dollar usage and add a price-insensitive buyer at the front of the curve, rather than competing with the dollar. Reserve managers are not switching. They are adding a layer.
Policy implications
- Aim at the right account. If the binding constraint is fiscal, tariffs and engineered dollar depreciation target the wrong variable. The 9.4% fall in the dollar in 2025 left the deficit near 3% of GDP. A credible medium-term path for the primary balance is the lever that moves the constraint.
- Do not tax the reserve bid by accident. Proposals to make foreign official holders pay for the privilege, by forcing them into long-dated or non-marketable debt or charging fees, would weaken the price-insensitive demand that keeps term premia contained. The buyer base is already shifting from official to levered private holders.
- If you believe Pettis, the coherent tool is a tax on inflows, not tariffs. It targets the capital account directly. Its cost is higher US funding costs, which the fiscal arithmetic makes expensive. The trade-off should be stated openly.
- Keep paying the duty. Standing swap lines and the FIMA repo facility lower the precautionary demand for owned reserves, and with it the pressure to accumulate gold. They are cheap insurance for the system.
- Improve the statistics. A BEA supplementary series that adjusts primary income and services exports for profit shifting would separate return privilege from tax accounting. The spread-versus-threshold series is cheap to publish quarterly and belongs on the external-sustainability dashboard.
- Remember the road not taken. Keynes’s 1943 Clearing Union, with symmetric charges on creditor as well as debtor balances, had no reserve asset to run short of and so no Triffin problem. The creditor of 1944, the United States, rejected it. In 2009 the People’s Bank of China, the creditor of the next era, called the approach “farsighted” [43]. Reserve accumulation is the ongoing price of refusing symmetric adjustment. A clearing union is not on the table, but the comparison clarifies what the current system trades away.
What would change the view
| Observation | What it would refute or weaken | Current reading (15 Oct 2026) |
|---|---|---|
| Spread back above break-even by >0.5pp for several quarters | The erosion reading of Section 6 | Below by ~0.1pp (Q2 2026) |
| Profit-shifting-adjusted data showing a stable adjusted gap since 2019 | The direction-of-travel claim | Not available |
| Foreign official Treasury holdings rising as a share of the total | The claim that the official-flow channel is dormant | Falling (40.8% vs 42.7% a year ago) |
| Term premium compressing toward zero while deficits widen | The fiscal-constraint thesis | 1.07% (Kim–Wright, 9 Oct), up from 0.87% at end-July |
| Dollar falling while long yields rise, persistently | Would confirm a credit reading; its absence weakens the urgent version | Not present: DXY and yields both up since August |
| Real yields falling sharply with rising inflation (repression) | The view that the constraint is binding only gradually | Not present: 10y TIPS 2.84% |
| Central-bank gold buying back below ~470t a year | Stratification as a regime | 863t (2025); 345t (H1 2026) |
| A G20 central bank disclosing a material bitcoin allocation | The reading of bitcoin as a non-candidate | None |
| A durable return to current-account surplus with reserve share intact | Nothing. It would further confirm Section 4 | — |
Conclusion
The reserve currency does not have to run a trade deficit. Triffin’s dilemma concerned official claims on a fixed gold stock, and the United States supplied the world’s reserves for a quarter-century while running trade surpluses. The accounting identity binds net flows, not gross ones, and the reserve function is carried out on the liability side of the balance sheet. Reserve status enables deficits by removing the external financing constraint. Whether the deficit is then generated at home or imposed by surplus countries abroad is a real debate, but it is a debate about saving, capital markets and policy, not about the monetary role of the dollar.
What survives of Triffin is the confidence horn, now expressed in fiscal terms. Net interest has matched its 1991 record and is projected to keep climbing. The foreign official bid is shrinking as a share of demand. And the income account, the arithmetic that let a net debtor earn net income, has crossed into deficit. On the current data the threshold rose above the spread in 2024 and has stayed above it through mid-2026, mainly because of two decades of leverage, much of it unrealized equity gains in foreign hands, and partly because the spread has narrowed since 2019. The exact crossing date depends on how much of the measured return is tax accounting; the direction does not.
Gold and bitcoin answer a different question. They insure against counterparty and confiscation risk, but neither can expand with the world’s need for settlement, which is why the dollar was needed in the first place. The likely destination is a layered system: dollars for liquidity, gold for insurance, and a United States whose privilege now depends on keeping its fiscal promises credible.
Appendix A. Data and method
Figures were produced with my own Python scripts from the public sources cited. Inputs: FRED series from BEA, Treasury, OMB and the Federal Reserve; TIC Table 5; ERP 2005 Table B-103; the BEA current-account history; IMF COFER via DBnomics; Yahoo Finance daily closes.
FRED series used: IEAXIA, IEAMIA, IEAXIIA, IEAMIIA, IEABCPIA, IEAXI, IEAMI, IEAXII, IEAMII, IEABCPI, IEABCA, IEABC, IEABCGS, IEABCSI, IEASDA, IIPUSASSA, IIPUSLIAA, IIPUSNETIA, IIPUSASSQ, IIPUSLIAQ, IIPUSNETIQ, GDP, GDPA, FYOINT, FYGDP, FYPUGDA188S, FYFSD, FYGFDPUN, FDHBFIN, BOGZ1LM263064105Q, DGS5, DGS10, DGS30, DFII10, T10YIE, THREEFYTP10. Retrieved 15 October 2026.
Hand-entered inputs, sourced in the references: World Gold Council central-bank tonnages [33][34]; the COFER 2026 Q1–Q2 dollar shares from the IMF data brief [31]; CBO projections [17].
Appendix B. Full annual income-test series
| Year | Yield earned (%) | Yield paid (%) | Spread (pp) | L̄/Ā | Break-even (pp) | Gap (pp) | Net primary income ($bn) | Net investment income ($bn) |
|---|---|---|---|---|---|---|---|---|
| 1999 | 4.33 | 3.65 | 0.67 | 1.15 | 0.53 | 0.14 | 10.0 | 17.2 |
| 2000 | 4.79 | 3.95 | 0.85 | 1.17 | 0.66 | 0.19 | 14.6 | 22.1 |
| 2001 | 4.20 | 3.09 | 1.11 | 1.26 | 0.80 | 0.31 | 23.2 | 31.2 |
| 2002 | 4.30 | 3.05 | 1.25 | 1.33 | 1.01 | 0.25 | 17.5 | 25.8 |
| 2003 | 4.42 | 3.12 | 1.31 | 1.30 | 0.93 | 0.37 | 29.3 | 37.9 |
| 2004 | 4.51 | 3.24 | 1.27 | 1.24 | 0.78 | 0.49 | 46.6 | 56.4 |
| 2005 | 4.48 | 3.49 | 0.98 | 1.18 | 0.62 | 0.37 | 44.2 | 55.8 |
| 2006 | 4.50 | 3.91 | 0.59 | 1.12 | 0.48 | 0.11 | 16.0 | 27.6 |
| 2007 | 4.40 | 3.74 | 0.66 | 1.08 | 0.31 | 0.35 | 64.4 | 75.2 |
| 2008 | 4.09 | 3.12 | 0.97 | 1.13 | 0.41 | 0.56 | 112.0 | 123.9 |
| 2009 | 3.36 | 2.36 | 1.00 | 1.17 | 0.40 | 0.59 | 115.5 | 123.7 |
| 2010 | 3.51 | 2.39 | 1.12 | 1.12 | 0.30 | 0.82 | 169.9 | 177.5 |
| 2011 | 3.60 | 2.31 | 1.29 | 1.16 | 0.37 | 0.92 | 202.4 | 210.3 |
| 2012 | 3.54 | 2.21 | 1.33 | 1.20 | 0.45 | 0.88 | 197.9 | 205.9 |
| 2013 | 3.48 | 2.18 | 1.31 | 1.22 | 0.47 | 0.84 | 195.5 | 204.1 |
| 2014 | 3.46 | 2.11 | 1.36 | 1.26 | 0.54 | 0.82 | 200.2 | 209.7 |
| 2015 | 3.43 | 2.04 | 1.39 | 1.30 | 0.62 | 0.77 | 185.2 | 195.3 |
| 2016 | 3.63 | 2.10 | 1.54 | 1.34 | 0.70 | 0.83 | 196.4 | 207.4 |
| 2017 | 3.87 | 2.18 | 1.68 | 1.31 | 0.68 | 1.00 | 257.9 | 268.5 |
| 2018 | 4.19 | 2.41 | 1.78 | 1.33 | 0.81 | 0.97 | 255.3 | 265.6 |
| 2019 | 4.22 | 2.37 | 1.86 | 1.40 | 0.94 | 0.92 | 247.4 | 259.3 |
| 2020 | 3.13 | 1.84 | 1.30 | 1.39 | 0.71 | 0.58 | 177.7 | 185.3 |
| 2021 | 3.13 | 1.98 | 1.15 | 1.41 | 0.80 | 0.35 | 117.2 | 128.4 |
| 2022 | 3.58 | 2.22 | 1.36 | 1.45 | 0.99 | 0.37 | 121.5 | 140.3 |
| 2023 | 4.16 | 2.74 | 1.42 | 1.48 | 1.31 | 0.10 | 33.5 | 55.6 |
| 2024 | 4.15 | 2.78 | 1.37 | 1.56 | 1.57 | -0.20 | -68.7 | -46.2 |
| 2025 | 3.89 | 2.57 | 1.32 | 1.56 | 1.44 | -0.12 | -47.6 | -24.9 |
References
- Robert Triffin, statement to the Joint Economic Committee, Employment, Growth, and Price Levels, Part 9A, 28 Oct 1959; and Gold and the Dollar Crisis, Yale University Press, 1960. https://fraser.stlouisfed.org/files/docs/historical/jec/1959_jec_empgrowth_part9a.pdf
- Michael D. Bordo and Robert N. McCauley, “Triffin: Dilemma or Myth?”, IMF Economic Review 67(4), 2019; NBER WP 24195; BIS WP 684. https://www.bis.org/publ/work684.pdf
- Federal Reserve History, “Nixon Ends Convertibility of U.S. Dollars to Gold and Announces Wage/Price Controls”. https://www.federalreservehistory.org/essays/gold-convertibility-ends
- Economic Report of the President 2005, Table B-103, “U.S. international transactions, 1946–2004”. https://www.govinfo.gov/content/pkg/ERP-2005/html/ERP-2005-table103.htm ; Federal Reserve Bulletin, March 1960 (1959 “first annual deficit since 1953”). https://fraser.stlouisfed.org/title/federal-reserve-bulletin-62/march-1960-21303/fulltext
- BEA, “U.S. Current-Account Balance”, annual 1960–2024 (24 June 2025). https://www.bea.gov/sites/default/files/2025-06/trans125-annual-current-account-balance.pdf
- BEA, U.S. International Transactions and International Investment Position (annual update 24 June 2026; Q2 2026 release), via FRED. https://fred.stlouisfed.org/series/IEABCPI ; https://fred.stlouisfed.org/series/IIPUSNETIQ
- Federal Reserve History, “Creation of the Bretton Woods System” and “Launch of the Bretton Woods System” (operational with current-account convertibility, December 1958). https://www.federalreservehistory.org/essays/bretton-woods-launched
- Maurice Obstfeld, “Don’t blame America’s current account deficit on the dollar”, PIIE Realtime Economics, 13 April 2026. https://www.piie.com/blogs/realtime-economics/2026/dont-blame-americas-current-account-deficit-dollar
- Pierre-Olivier Gourinchas and Hélène Rey, “From World Banker to World Venture Capitalist: US External Adjustment and the Exorbitant Privilege”, in Clarida (ed.), G7 Current Account Imbalances, University of Chicago Press, 2007; NBER WP 11563. https://www.nber.org/papers/w11563
- Stephen Miran, A User’s Guide to Restructuring the Global Trading System, Hudson Bay Capital, November 2024. https://www.hudsonbaycapital.com/documents/FG/hudsonbay/research/638199_A_Users_Guide_to_Restructuring_the_Global_Trading_System.pdf
- Reuters, “Fed Governor Miran quits White House job”, 3 Feb 2026, https://www.reuters.com/world/us/feds-miran-resigns-white-house-job-2026-02-03/ ; Federal Reserve Board press release, 14 May 2026 (resignation effective on or shortly before his successor’s swearing-in), https://www.federalreserve.gov/newsevents/pressreleases/other20260514b.htm
- Michael Pettis, “An Exorbitant Burden”, Carnegie Endowment, 7 Sep 2011, https://carnegieendowment.org/posts/2011/09/an-exorbitant-burden ; Matthew C. Klein and Michael Pettis, Trade Wars Are Class Wars, Yale University Press, 2020.
- Ben S. Bernanke, “The Global Saving Glut and the U.S. Current Account Deficit”, 10 March 2005, https://www.federalreserve.gov/boarddocs/speeches/2005/200503102/ ; Dooley, Folkerts-Landau and Garber, “An Essay on the Revived Bretton Woods System”, NBER WP 9971, 2003.
- Michael D. Bordo and Robert N. McCauley, “Miran, we’re not in Triffin land anymore”, CEPR/VoxEU, 7 April 2025. https://cepr.org/voxeu/columns/miran-were-not-triffin-land-anymore
- Choi, Goldberg, Lerman and Ravazzolo, “The Fed’s Central Bank Swap Lines and FIMA Repo Facility”, FRBNY Economic Policy Review 28(1), 2022. https://www.newyorkfed.org/medialibrary/media/research/epr/2022/epr_2022_fima-repo_choi.pdf
- Emmanuel Farhi and Matteo Maggiori, “A Model of the International Monetary System”, QJE 133(1), 2018; and “The new Triffin dilemma”, VoxEU, 20 Dec 2017. https://cepr.org/voxeu/columns/new-triffin-dilemma-concerning-fiscal-and-external-trajectories-us
- Congressional Budget Office, The Budget and Economic Outlook: 2026 to 2036, February 2026. https://www.cbo.gov/publication/61882 (see also https://www.cbo.gov/publication/62105)
- OMB/Treasury fiscal-year series via FRED: FYOINT, FYGDP, FYPUGDA188S, FYFSD. https://fred.stlouisfed.org/series/FYOINT
- U.S. Treasury, TIC Table 5, “Major Foreign Holders of Treasury Securities” (data to July 2026). https://ticdata.treasury.gov/resource-center/data-chart-center/tic/Documents/slt_table5.txt
- FRED, FDHBFIN (Federal debt held by foreign and international investors) and FYGFDPUN (Federal debt held by the public). https://fred.stlouisfed.org/series/FDHBFIN
- FRED: DGS5, DGS10, DGS30, DFII10, T10YIE; Kim–Wright 10-year term premium THREEFYTP10. https://fred.stlouisfed.org/series/THREEFYTP10
- Maurizio Michael Habib, “Excess returns on net foreign assets: the exorbitant privilege from a global perspective”, ECB Working Paper 1158, 2010.
- Stephanie E. Curcuru, Tomas Dvorak and Francis E. Warnock, “Cross-Border Returns Differentials”, QJE 123(4), 2008, 1495–1530. https://www.nber.org/papers/w13768
- Stephanie E. Curcuru, Charles P. Thomas and Francis E. Warnock, “On Returns Differentials”, Journal of International Money and Finance 36, 2013, 1–25. https://www.federalreserve.gov/pubs/ifdp/2013/1077/ifdp1077.pdf
- Brad W. Setser, “Dark Matter. Soon To Be Revealed?”, CFR Follow the Money, 2 Feb 2017, https://www.cfr.org/articles/dark-matter-soon-be-revealed ; and “The U.S. Income Balance Puzzle”, CFR, https://www.cfr.org/articles/us-income-balance-puzzle
- Fatih Guvenen, Raymond J. Mataloni Jr., Dylan G. Rassier and Kim J. Ruhl, “Offshore Profit Shifting and Aggregate Measurement: Balance of Payments, Foreign Investment, Productivity, and the Labor Share”, American Economic Review 112(6), 2022.
- Ricardo Hausmann and Federico Sturzenegger, “The Missing Dark Matter in the Wealth of Nations and Its Implications for Global Imbalances”, Economic Policy 22(51), 2007.
- Pierre-Olivier Gourinchas, Hélène Rey and Nicolas Govillot, “Exorbitant Privilege and Exorbitant Duty”, IMES Discussion Paper 2010-E-20, https://www.imes.boj.or.jp/research/papers/english/10-E-20.pdf ; Gourinchas and Rey, CEPR DP16944, 2022, https://cepr.org/publications/dp16944
- Andrew Atkeson, Jonathan Heathcote and Fabrizio Perri, “The End of Privilege: A Reexamination of the Net Foreign Asset Position of the United States”, NBER WP 29771, 2022. https://www.nber.org/papers/w29771
- Federal Reserve, Financial Accounts of the United States (Z.1), rest of the world; corporate equities; asset (FRED BOGZ1LM263064105Q). https://fred.stlouisfed.org/series/BOGZ1LM263064105Q
- IMF, COFER data brief, 30 Sep 2026 (2026 Q2: USD 56.70%, total FX reserves $13.22tn), https://data.imf.org/en/news/imf%20data%20brief%20september%2030 ; COFER historical shares via DBnomics, https://db.nomics.world/IMF/COFER
- European Central Bank, The International Role of the Euro, June 2026. https://www.ecb.europa.eu/press/other-publications/ire/html/ecb.ire202606.en.html
- World Gold Council, Gold Demand Trends Full Year 2025, central banks. https://www.gold.org/goldhub/research/gold-demand-trends/gold-demand-trends-full-year-2025/central-banks
- World Gold Council, Gold Demand Trends Q2 2026, central banks (30 July 2026). https://www.gold.org/goldhub/research/gold-demand-trends/gold-demand-trends-q2-2026/central-banks
- World Gold Council, Central Bank Gold Reserves Survey 2026. https://www.gold.org/goldhub/research/central-banks
- World Gold Council, “How much gold has been mined?”. https://www.gold.org/goldhub/data/how-much-gold
- LBMA, Precious Metals Market Report Q4 and full year 2025, https://www.lbma.org.uk/articles/lbma-precious-metals-market-report-q4-and-full-year-2025 ; VanEck, “A Golden Year with More Leverage Ahead”, 14 Jan 2026, https://www.vaneck.com/us/en/blogs/gold-investing/ima-casanova-a-golden-year-with-more-leverage-ahead/
- Yahoo Finance daily closes for GC=F, SI=F, GDX, BTC-USD and DX-Y.NYB, retrieved 15 Oct 2026; returns are my calculations.
- Executive Order 14233, “Establishment of the Strategic Bitcoin Reserve and United States Digital Asset Stockpile”, 90 FR 11789, 11 March 2025. https://www.federalregister.gov/documents/2025/03/11/2025-03992/establishment-of-the-strategic-bitcoin-reserve-and-united-states-digital-asset-stockpile
- Axios, “Treasury secretary clarifies Trump administration’s crypto plans”, 14 Aug 2025, https://www.axios.com/2025/08/14/treasury-secretary-clarifies-trump-administrations-crypto-plans ; Decrypt, “Bessent Backtracks on Bitcoin”, https://decrypt.co/335355/bessent-backtracks-bitcoin-treasury-committed-budget-neutral-btc-buys
- CryptoSlate, “The US says it has a Bitcoin reserve, but nobody can agree on how much it owns”, https://cryptoslate.com/the-us-says-it-has-a-bitcoin-reserve-but-nobody-can-agree-on-how-much-it-owns/ ; Arkham Intelligence, “U.S. Government Bitcoin Holdings 101”, https://info.arkm.com/research/u-s-government-bitcoin-holdings-101 ; crypto.news, “Inside the Strategic Bitcoin Reserve: promise vs reality”, 1 June 2026.
- BITCOIN Act of 2025 (S.954, 119th Congress), introduced 11 March 2025. https://www.congress.gov/bill/119th-congress/senate-bill/954
- J. M. Keynes, Proposals for an International Clearing Union, Cmd. 6437, April 1943; Zhou Xiaochuan, “Reform the International Monetary System”, PBoC, 23 March 2009, BIS Review 41/2009, https://www.bis.org/review/r090402c.pdf
- Barry Eichengreen and Marc Flandreau, “The Rise and Fall of the Dollar (or When Did the Dollar Replace Sterling as the Leading Reserve Currency?)”, European Review of Economic History 13(3), 2009; NBER WP 14154. https://www.nber.org/papers/w14154 ; Maylis Avaro, “Zombie International Currency: The Pound Sterling 1945–1971”, Journal of Economic History 84(3), 2024.
- Federal Reserve Bank of St. Louis, “The U.S. Dollar’s Role as a Reserve Currency”, Open Vault, February 2026. https://www.stlouisfed.org/open-vault/2026/feb/us-dollar-role-as-reserve-currency
- Perry Mehrling, “The Inherent Hierarchy of Money”, in Taylor, Rezai and Michl (eds.), Social Fairness and Economics, Routledge, 2013.
Chafic Charafeddine writes independent research at chafic.me. This article reflects only my views. It is not affiliated with, commissioned by, or written on behalf of any employer, client or institution, and it is not investment advice or a recommendation to buy or sell any security or asset. Data as retrieved on 15 October 2026. Figures will be revised; refresh before relying on them.